Key Health Data for the West Midlands 2005
CHAPTER TWO: QUALITY OF PRIMARY CARE AND HEALTH INEQUALITIES
Main Body
2.1 Introduction
The aim of this chapter is to introduce the Quality Outcomes Framework (QOF) to a wider audience and highlight how it can be used to inform policy areas other than the quality agenda.
The national Quality and Outcomes Framework was introduced as part of the new General Medical Services (GMS) contract on 1 April 2004, therefore 2004/05 represents the first year for which QOF information is available. Participation by practices in the QOF is voluntary, with very high participation rates. 8,486 practices covering 99.5% of registered patients in England took part in the 2005 QOF.
It is based on the best available research evidence and represents the first example of a public healthcare system that will systematically reward practices on the basis of the quality of care delivered to patients. This, in turn, will benefit both patients and the wider NHS. For example, a reduction in avoidable hospital admissions should result from improved chronic disease management.
The QOF is not about performance management of general practice but about resourcing and then rewarding good practice. Practices may on occasion exclude specific patients from data collected to calculate QOF achievement scores. For example, patients with specific diseases can be excluded from the denominators of individual QOF indicators if the practice is unable to deliver recommended treatments to those patients (the GMS contract sets out valid exception criteria) these are referred to as exceptions.
The QOF measures achievement against 146 indicators and three measures of depth of care. Practices score points on the basis of achievement against each indicator, up to a maximum of 1,050 points. The QOF contains four ‘domains’. Each domain contains a range of areas described by key indicators. The indicators describe different areas of achievement. These are
- Clinical Domain: 76 indicators in 11 areas (Coronary Heart Disease, Left Ventricular Dysfunction, Stroke and Transient Ischaemic Attack, Hypertension, Diabetes Mellitus, Chronic Obstructive Pulmonary Disease, Epilepsy, Hypothyroidism, Cancer, Mental Health and Asthma) worth up to a maximum of 550 points (52.4% of the total).
- Organisational Domain: 56 indicators in 5 areas (Records and Information, Patient Communication, Education and Training, Medicines Management, Clinical and Practice Management) worth up to 184 points (17.5% of the total).
- Patient Experience Domain: 4 indicators in 2 areas (Patient Survey and Consultation Length) worth up to 100 points (9.5% of the total).
- Additional Services Domain: 10 indicators in 4 areas (Cervical Screening, Child Health Surveillance, Maternity Services and Contraceptive Services) worth up 36 points (3.4% of the total).
The depth of quality measures.
- A holistic care payment measures achievement across the clinical domain.
- A quality practice payment which measures overall achievement in the organisational, patient experience and additional services domains.
- A target level of achievement on patient access to clinical care
This chapter concentrates on the Clinical domain as this has the greatest relevance to the work of public health in delivering Choosing Health and reducing the inequalities in health.
Details of the GMS contract can be found on the Department of Health website. A full set of QOF tables can be found at http://www.ic.nhs.uk/services/qof
2.2 QOF across the West Midlands
Across the West Midlands, 990 practices took part ranging in population size from 250 to 23,442 (average 5,642).
2.2.1 Overall domain performance
The QOF scores can be compared by domain or by indicator depending on how much detail you require. Figure 2.01, shows the variation in achievement across the PCTs by domain and the three depth of quality measures. The boxes show the range from the lower to upper quartiles (50% of PCTs will lie between these limits) while the “whiskers” show the range from the minimum to maximum values. In the clinical (disease) domain no practice scored less than 80% of the points available. The domain in which PCTs achieved fewer points was for quality practice.
Figure 2.01: Range of scores achieved by practices by domain across West Midlands, 2005
 |
Range of scores achieved by PCTs by domain across West Midlands |
2.2.2 Clinical domain performance
As described above, each domain is composed of a series of sub-domains and indicators so it is possible to look at further detail and to examine the delivery of care in greater detail, for example, Figure 2.02 presents the percentage of points achieved in the sub-domain of CHD which is in the clinical domain by PCT. There is quite a variation in performance across PCTs with Herefordshire achieving nearly 99.6% of points available, whilst Wednesbury and West Bromwich achieved just 87.6%.
Figure 2.02: Average clinical domain scores achieved by PCT across West Midlands, 2005
 |
Average clinical domain scores |
2.2.3 Indicator level analysis
Each of the clinical sub domains are composed of a series of indicators. For the example of CHD there are 12 indicators for which the numerator and denominators are published alongside the points achieved:
- The practice can produce a register of patients with coronary heart disease
- The percentage of patients with newly diagnosed angina (diagnosed after 1 April 2003) who are referred for exercise testing and/or specialist assessment
- The percentage of patients with coronary heart disease whose notes record smoking status in the past 15 months, except those who have never smoked where smoking status need be recorded only once since diagnosis
- The percentage of patients with coronary heart disease who smoke, whose notes contain a record that smoking cessation advice or referral to a specialist service, where available, has been offered within the last 15 months
- The percentage of patients with coronary heart disease whose notes have a record of blood pressure in the previous 15 months
- The percentage of patients with coronary heart disease in whom the last blood pressure reading (measured in the last 15 months) is 150/90 or less
- The percentage of patients with coronary heart disease whose notes have a record of total cholesterol in the previous 15 months
- The percentage of patients with coronary heart disease whose last measured total cholesterol (measured in last 15 months) is 5 mmol/ l or less
- The percentage of patients with coronary heart disease with a record in the last 15 months that aspirin, an alternative anti-platelet therapy, or an anti-coagulant is being taken (unless a contraindication or side-effects are recorded)
- The percentage of patients with coronary heart disease who are currently treated with a beta blocker (unless a contraindication or side-effects are recorded)
- The percentage of patients with a history of myocardial infarction (diagnosed after 1 April 2003) who are currently treated with an ACE inhibitor or angiotensin II antagonist
- The percentage of patients with coronary heart disease who have a record of influenza immunisation in the preceding 1 September to 31 March
Using the numerator and denominators for indicator 6 it is possible to calculate the percentage of practices that have patients with good blood pressure control. In 65.2% of practices 80% of patients with CHD had a blood pressure under 150/90 across the West Midlands. In Figure 2.03, this data is shown by SHA. Birmingham and the Black Country has the least practices (64.9%) achieving the 80% level, whereas West Midlands South the most 75.7%. As we know the number of patients with CHD, 203781, we can estimate that over 71,000 are likely to have elevated blood pressure.
Figure 2.03: Percentage of practices across the West Midlands with patients whose blood pressure under 150/90 by strategic health authority
 |
% of practices with patients whose blood pressure < 150/90 by SHA |
2.5 Prevalence
With the creation of disease registers within practices being at the centre of the QOF process it is possible for the first time to produce estimates of disease prevalence for 11 long term conditions. The registers also provide for the first time a count of those living with a condition and therefore it is possible to say how many people are living with a condition in the West Midlands (see table 2.01).
Table 2.01: National Prevalence Values
| National Prevalence Values |
The distribution of prevalence at PCT level is shown in Figure 2.04. The boxes show the range from the lower to upper quartiles (50% of practices will lie between these limits) while the “whiskers” show the range from the minimum to maximum values. The greatest variation in any one condition is in the prevalence of hypertension ranging from 8.8% in Heart of Birmingham PCT to 14.1% in North Stoke. The prevalence measurements for each PCT can be found in the supporting CD. Compared to England, in the West Midlands more people have been diagnosed with hypertension and diabetes (Table 2.01). The prevalence of any condition will be very dependent on the demographics of the population in particular its age sex structure and the size of the ethnic population. As the prevalences are not adjusted for these factors it is not possible to say whether the variations in prevalence reported are a true reflection of how many people are living with the condition or whether it is better case identification in primary care.
Figure 2.4: The variation in prevalence values by PCT across the West Midlands
 |
The variation in prevalence values by PCT across the West Mids. |
2.6 Using QOF to improve services
The introduction of QOF has enabled us to assess for the first time prevalence in terms of case identification by General Practices and to compare this with a measure of population health, such as the incidence of admission, or mortality. Comparing these two datasets we can show the extent to which GP practices are diagnosing CHD paralleled to escalating death rates (Figures 2.05 and 2.06).
Figure 2.05 shows the areas with the greatest prevalence of CHD as recorded by QOF across Birmingham. This is highest in the north and south of the city. These are areas with mainly white and older populations. The areas with the lowest levels are in the centre, where there is a greater density of younger black and minority ethnic populations. Age could explain some of this variation as CHD tends to be a disease that affects people over the age of 65 and therefore CHD would not be such a great problem in these younger populations, although the prevalence of CHD is higher in Asian populations.
Figure 2.06, shows the standardised mortality ratio for those aged under 75 and it has a stark reversal of pattern. Those dying prematurely of CHD are living in the areas where there is little recorded prevalence of the disease. The two measures are significantly negatively correlated, as prevalence goes down, mortality goes up (r2 - 0.21 p<0.01). There are areas where there are both high prevalence and high mortality and these tend to be in the South and East of the city.
This work has led to a project to improve case identification and chronic disease management programmes within general practice based primary care, particularly working with those practices where death rates are higher than average and where prevalence, as measured by QOF, is lower than expected. With the QOF data it will be possible on a routine and regular basis to track over time to see whether improving QOF performance for CHD will address this imbalance in premature deaths.
Figure 2.05 Prevalence of CHD by SOA as measured by QOF
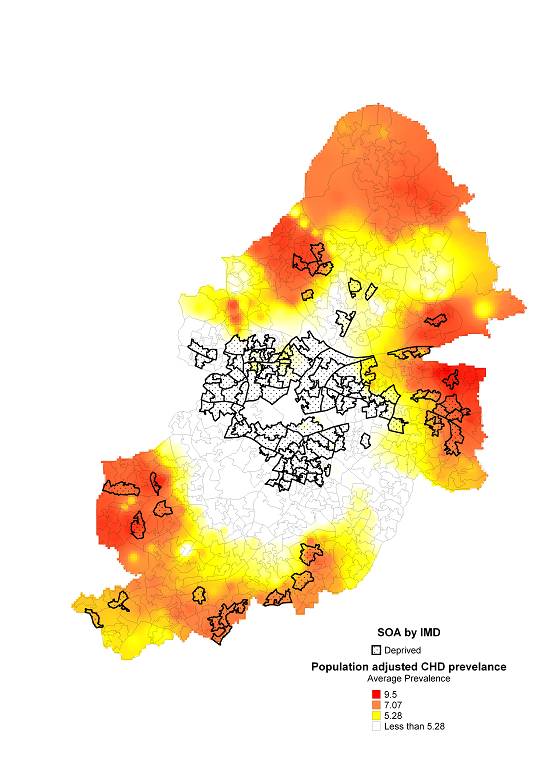 |
Prevalence of CHD by SOA as measured by QOF |
Figure 2.06 Standardised mortality ratio for those under age of 75 dying from CHD
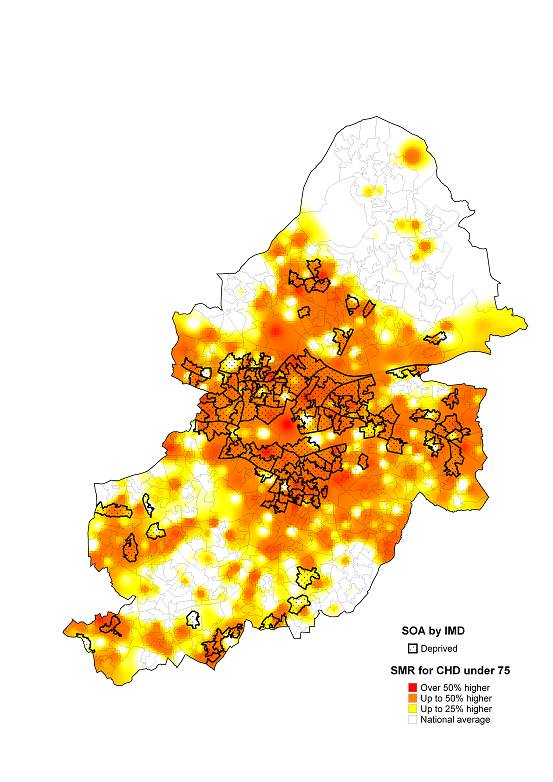 |
Standardised mortality ratio for those under age of 75 dying from CHD |