West Midlands Key Health Data 2006/07
CHAPTER NINE: SMOKING AND SMOKING CESSATION: HEALTH EFECTS AND PREVALENCE TRENDS
THE SEARCH FOR DATA AND AN OVERVIEW OF RESOURCES
Amanda Parsons and Dr Paul Aveyard
Main Body
7: Childhood Obesity Monitoring And Prevention Research
8: Treatment For Drug Misuse In The West Midlands 2005/6
9: Smoking And Smoking Cessation: Health Efects And Prevalence Trends
9.1 Introduction
Humans ignite tobacco and inhale the smoke in various ways (cigarettes, cigars, pipes, bidis), chew it (spit tobacco) or retain it in their mouth (snus), or take it intranasally. New tobacco inhalation devices are also being developed that might reduce the harm from inhaling smoke by heating it. However, cigarette smoking is the only common method of consumption in the UK. It is also the most harmful method of consumption(1).
Smoking is the single greatest cause of preventable disease and premature death in the UK(2). Although national trends in smoking prevalence have decreased over the past decades, a quarter of the population still smoke. At the current prevalence rate, about 106 000 people will continue to die each year due to smoking(3) . According to the most recent national survey 22% of the people in the West Midlands smoke(4).
Smoking cessation is high on the political agenda as the costs of smoking are high to the health of the general public and the NHS. In the White Paper “Smoking Kills” the government set a target for national smoking prevalence to reduce from 28% in 1996 to 24% or less by 2010. This target was reduced down to 21% by 2010 in the 2004 Public Service Agreement. Based on experience from other countries, we can expect the 1st of July smoking ban in public places will further reduce prevalence however it is the concern of the service and academic smoking cessation community that this effect doesn’t fizzle out. There is still much work to be done to permanently reduce smoking prevalence and the associated illness and death in the UK.
Estimating prevalence at the level of PCT requires adequate sampling at a local level, and currently this requirement is not met by national surveys. Recently, data has become available at the level of PCT using synthetic estimates that are calculated using multilevel modelling based on pooled year-on-year national data(3).
This chapter will serve as an introduction to smoking, outlining the consequences for health and the benefits of cessation, current national prevalence data and local synthetic estimates. The chapter will also serve to signpost the help available to aid quitting.
9.2: Tobacco and Health
The Consequences of Smoking Tobacco on HealthThe causal link between smoking, ill health and death is firmly established(5). In the UK, smoking kills about 106 000 people per year(3) which is about 12 deaths per hour. It is responsible for half of the deaths of all those who continue to smoke, and a half of these deaths occur before the age of retirement (1;6;6). The relative risk for all-cause mortality for smokers is estimated at 2.3(7) for men and 1.8(8) for women. This means that people who smoke are about twice as likely to die at any given age. The size of the risk varies with the number of cigarettes smoked, from 1.79 among smokers of 1-15/day to 2.61 among smokers of 25 or more/day(9).
Smoking kills people primarily by inducing:
- Cardiovascular disease (ischaemic heart disease and stroke)
- Some cancers and
- Respiratory disease (primarily Chronic Obstructive Pulmonary Disease COPD).
A full list of the diseases that are associated with smoking, along with an appraisal of the evidence linking the exposure (smoking) to the outcome (the disease) is presented in the Surgeon General’s Report(10).
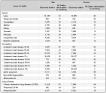
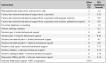
The following table outlines the contribution of tobacco smoking to various fatal diseases(11)
Table 9.1: Proportion of deaths attributable to smoking (Based on deaths in England 1998-2002)(3)
|
9.3: The Benefits of Smoking Cessation
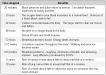
There is strong evidence that stopping smoking, however late in life, can reduce risk of premature death and improve current and future health(12). The benefits to cessation begin immediately after cessation and extend for years, see table below.
Table 9.2: The benefits of smoking cessation
|
The longitudinal study following a cohort of British doctors has enabled estimates to be made of life years gained when stopping smoking in different age categories (12). These are summarised below
Table 9.3: Life years gained after quitting by age category
|

We can make a calculation from this that for every decade smoked after the age of 40 years, people lose 3 years of life. In other words, each year of smoking over the age of 40 years loses a smoker 3.6 months, which emphasises the imperative to give up soon (1).
Pregnancy
Smoking is the most important modifiable risk factor for poor outcome in pregnancy. Smoking causes an increased risk of placenta previa, placental abruption, but lowers the incidence of pre-eclampsia. Smoking causes preterm delivery and fetal growth restriction. There is also some evidence that suggests that smoking increases the risk of miscarriage(13).
Stopping smoking reduces the incidence of preterm delivery and intrauterine growth restriction and interventions to help women stop have shown clear evidence of these benefits(14).
Smoking and pregnancy is further explored in chapter twelve.
9.4 The Smoking Epidemic in the UK
Tobacco was introduced to Europe at the end of the 15th century and became widely popular by the end of the 16th century. Lopez described four phases of a tobacco epidemic, a pattern which has emerged in several developed countries after the introduction of tobacco (15). The UK is in the fourth phase, where smoking becomes increasingly concentrated in the most disadvantaged sectors of society. Forty years ago, there was little association between smoking and disadvantage. It is becoming increasingly strong and this will continue unless specific public health actions are taken(1)
9.5 The Collection of Tobacco Use Data
National Smoking Data
(1) The General Household Survey (GHS) collects data annually from a selected sample of households in Great Britain. In the most recently published survey, conducted in 2005, 12,802 households/30 069 people participated (13 000 households were contacted to participate). Up until 2005, fieldwork for each survey has taken place during financial years. Fieldwork now takes place from January - December, and the 2005 GHS report includes data collected from April – December added to the last quarter of the 2004/5 survey (January – March 2005). The GHS reports smoking prevalence at a national level and to the level of the West Midlands as a whole. A link to the most recently published GHS section on smoking follows:
http://www.statistics.gov.uk/downloads/theme_compendia/GHS05/GHS2005_SmokingandDrinking_Report.pdf
(2) The National Statistics Omnibus Survey is smaller than the GHS, with a sample size of 1,800 adults contacted over the period of 1 month. The Omnibus Survey is designed to be a vehicle for providing quick results from relatively short and simple sets of questions. Question modules can be added in for one month or kept as part of the survey over a few months. To date, eleven surveys of smoking-related behaviour and attitudes have been conducted as part of the Omnibus Survey, all of which have included data collected over a two-month period. The smoking-related behaviour and attitudes surveys take smoking prevalence questions from the GHS and also include unique questions about various aspects of smoking behaviour and attitudes. The report presents data at a national level and is not broken down to Government Office Region. A link to the most recently published smoking-related behaviour and attitudes survey report follows:
http://www.statistics.gov.uk/downloads/theme_health/smoking2006.pdf
(3) The Health Survey for England (HSE) is a national private household survey commissioned by the Department of Health. The HSE has an annually repeating core accompanied by different topic modules each year that are repeated over a 5-year cycle. Smoking data is collected as part of the core survey. For the 2005 survey, 7,200 addresses were contacted to take part representing the general population and an additional 11,520 were contacted to create a boosted sample of people aged 65+. In total, 7,630 adults (16+) and 1,852 children took part in the survey from the general population sample and 2,673 adults aged 65+ and 1,142 children aged 2-15 years took part as part of the boosted sample. The sample used for the HSE is large enough to not only estimate national trends but also to produce estimates at the level of strategic health authority.
Links to the chapters of the full report of the 2005 survey and the updated trend tables can be found below:
http://www.ic.nhs.uk/statistics-and-data-collections/health-and-lifestyles/health-survey-for-england/health-survey-for-england-2005:-health-of-older-people-%5Bns%5D
http://www.ic.nhs.uk/statistics-and-data-collections/health-and-lifestyles/health-survey-for-england/health-survey-for-england--updating-of-trend-tables-to-include-2005-data
An additional set of raw smoking data is being collected by the smoking tool kit study (16). This is a longitudinal study collecting data on smoking and smoking cessation patterns in England in order to inform policy. Data is collected monthly and collection began in 2006. The data collected in this study varies slightly from the data collected by the annual surveys, possibly because respondents of the monthly surveys report a more accurate picture of their smoking behaviour. To find data collected by the smoking tool kit study click on the following link: www.smokinginengland.info
9.6 National Smoking Prevalence Trends
Population trends in smoking prevalence over time are dependant on the net effect of the number of people starting smoking, quitting and relapsing. Since the 1970s the net effect of these changes in behaviour has lead to a slow declining in smoking prevalence. Currently, overall prevalence is falling at around 0.4% per year(17).
Gender
More men are current smokers than women and this has been true since 1974, although the gap in prevalence has narrowed. According to the general household survey 2005, 25% of men and 23% of women were current smokers and overall smoking prevalence was 24%
Figure 9.1: Smoking prevalence in Great Britain by gender 1974 to 2005
|
Age
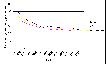
Smoking prevalence is 0% till the age of 10-11 years, rises through adolescence to a peak in the early twenties, and then falls slowly with age. Although smoking prevalence has reduced in all age categories since 1974, the most marked reduction has occurred in the older age groups.Figure 9.2: Percentage prevalence trends of smoking by age group in Great Britain 1974-2005
|

Socio-Economic Status
The prevalence of smoking varies by social class with more people smoking in lower socio-economic groups. Smoking is a root cause of socio-economic inequalities in health. There is 10% difference in smoking prevalence between manual and non-manual workers and this has not changed much over the past 10-15 years. An estimated 21% of the socio-economic inequality in mortality in men and 11% in women could be eliminated if everyone stopped smoking (18;19).
Figure 9.3: Percentage prevalence of smoking by socio-economic status in Great Britain in 1992-2006
|
Action on Smoking and Health (ASH), a non-governmental campaigning organisation, has mapped smoking prevalence and deprivation by ward for each government office region in England. The maps can be found in the smoking and deprivation section of the following website.(www.ash.org.uk)
Ethnic Group
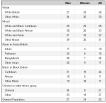
The prevalence of smoking varies by ethnic group, much more for women than for men (Table 9.4), where the prevalence of smoking is low among women from Asian ethnic backgrounds. However, the HABITS study shows that the prevalence of regular smoking among Asian girls in Year 11 (15 year olds) in South London was about 20%, similar to Black girls (22%), but lower than in white girls (36%)(20). If these data are followed nationally, the prevalence in Asian women will rise substantially over the next 30 years (1)
Table 9.4: Percentage prevalence of smoking by ethnic group and gender in Great Britain based on 2001-2005 data
|
9.7 Smoking in the West Midlands
The GHS and HSE give robust estimates for smoking prevalence by various different groups for Great Britain and England, respectively. These data can also be used to estimate prevalence in the West Midlands as a whole but does not allow robust direct estimates at local authority and PCT level, as the sample size would be too small.
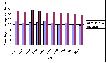
According to the GHS, percentage prevalence of total smokers for 2005 in the West Midlands is 22%. The range of percentage prevalence per region in 2005 was 29% (North East) - 22% (West Midlands, London and South East) (4). Smoking prevalence for the West Midlands estimated using data from the HSE is higher however, at 27%. The may be due to two reasons. Firstly, it is estimated from a merged data file of four runs of the HSE from 1998-2001 and smoking prevalence has come down since that time. Secondly, there may be sampling bias. Figure 9.4 shows how smoking prevalence has fallen since 1998 in the West Midlands.
Figure 9.4: Smoking prevalence in the West Midlands 1998 - 2005
|

At PCT level, smoking prevalence estimates are synthesized rather than taken directly from survey data. Synthetic estimates are calculated using multilevel modelling and the latest available are based on the merged data file from four runs of the HSE (1998-2001). Using published relative risks for smokers and ex-smokers and the synthetic estimates of prevalence of these behaviours it is possible to generate smoking-attributable mortality by PCT. For full methodological explanation, see appendix 1 of the HAD report “The smoking epidemic in England” (3) found at the following web address:
http://www.nice.org.uk/page.aspx?o=502811
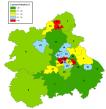
There is geographical variation in smoking behaviour and smoking-related mortality across the West Midlands, according to the HSE merged data file. Prevalence of current smoking behaviour ranges from 20%-40% and smoking-related mortality in males ranges from 17-40% and in females from 30-49%. Note, current smoking behaviour predicts future disease as there is a delay between smoking and the onset of the disease. The smoking-related mortality figures used in this report have been calculated using current smoking behaviour prevalence so the proportion attributable to smoking may in fact be higher as smoking prevalence was slightly higher in previous years. Maps 9.1 and 9.2 show smoking and ex-smoking prevalence across the PCTs in the West Midlands and Maps 9.3 and 9.4 show smoking-attributable mortality for males and females and finally Map 9.5 for all persons (Data was collected before the recent change in health boundaries).
The following five maps are constructed using data from the HDA report : The smoking epidemic in England 2004.
Map 9.1: Prevalence of smoking by PCT in the West Midlands (1998-2001) (3), pre 2006 boundaries
|
Map 9.2: Prevalence of ex-smokers by PCT in the West Midlands (1998 -2001) (3), pre 2006 boundaries
|

Map 9.3: Smoking attributable mortality in males by PCT in the West Midlands (1998-2004) (3), pre 2006 boundaries
|

Map 9.4: Smoking attributable mortality in females by PCT in the West Midlands (1998-2004) (3), pre 2006 boundaries
|

Map 9.5: Smoking attributable mortality in all persons by PCT in the West Midlands (1998-2004) (3), pre 2006 boundaries
|

Table 9.5: PCT Key for Maps 9.19.5, pre 2006 boundaries
|

9.8 Smoking Cessation
Prevalence of Wanting and Intending to Stop
Around 70% of current smokers want to stop smoking. This has remained fairly constant since 1998 when it was included in surveys(21). Most people give health and expense as the main reasons. 76% intend to stop smoking at some point, though only 12% intend to do so imminently (within a month), but more than half intend to do so in the next year, and nearly half expect not to be smoking in a year’s time(21).
Prevalence and Incidence of Attempts to Stop
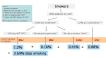
According to national surveys, 80% of the British smoking public have had at least one quit attempt during their time as a smoker, and about three fifths of those attempts have been in the last 5 years. (21). However, the Smoking Toolkit Study (22) found evidence that annual surveys underestimate the prevalence of attempts to stop smoking. Using different methods, the study estimates that 46% of smokers try to stop in a year, and that, on average, those that do make 1.7 attempts each. Thus, expressed as an incidence rate, the incidence of attempts at cessation is 78 attempts/100 smokers/year(23). The number of quit attempts and methods by which smokers attempt to quit is represented below. It is interesting to note that according to the smoking tool kit study only 3% of smokers use an NHS clinic to support them in their quit attempt. This is a very small percentage leading to only 0.45% of smokers stopping smoking. Using the NHS Stop Smoking Clinics quadruples a smoker’s chance of successfully quitting which underlines the need to increase access.
Figure 9.5: Prevalence of attempts to quit and methods used from the Smoking Toolkit Study
|
Hardcore Smoking
There are a group of smokers that have not attempted to stop in the past year and do not want or intend to do so in the future, called hardcore smokers. About 16% of smokers are hardcore smokers (24). They tend to be older, more dependent, and not believe smoking is influencing their health, but whether these beliefs are causes or consequences of their continued heavy smoking is not clear and the stability of their status as hardcore over time is uncertain.
Relapse
Although there is a high prevalence of wanting to stop among the smoking population, and also a large proportion of smokers make an attempt at quitting, there is a high rate of relapse. In a systematic review of the literature, Hughes et al reported that 5% of smokers that make an untreated quit attempts remain continuously abstinent after 6 months and 4% do so after 12 months (25).
Aids for Quitting
There are a variety of aids available to the smoker to support their quit attempt and increase their chance of being successful. The majority of treatments work by supporting the quitter through the withdrawal period as this is when they are most vulnerable to relapse. The newest treatment available is Varenicline (ChampixTM) a drug designed specifically to treat nicotine addiction. Varenicline is a partial agonist on a4b2 nicotinic receptors in the brain and it is thought to work by counteracting withdrawal symptoms and reducing smoking satisfaction. Trials of Varenicline have shown it to be more effective than Nicotine Replacement Therapy or Bupropion, with 28.8% of people being successfully quit at 6 months (effect size for Varenicline at 6 months = 16.7%). Table 9.6 shows the effect size (difference in ≥ 6 months abstinence rate between intervention and control/placebo from pooled analysis).(11)
Table 9.6: Effects of smoking cessation interventions on successful quitting for 6 months or longer
|
For more information on smoking, how to treat it and the evidence base for different treatments visit the following websites and BMJ article:
http://healthintelligence.bmj.com/hi/do/public-health/topics/content/smoking-cessation/index.html
http://www.doctorsandtobacco.org/index.php
Aveyard P, West R 2007 Managing smoking cessation BMJ 2007;335:37-41 (7 July) http://www.bmj.com/cgi/content/full/335/7609/37
9.9 Smoking Cessation Support
NHS Local Stop Smoking Services
The Government has set up a comprehensive NHS Stop Smoking Service. Services are administered locally and Local Stop Smoking Services run various clinics in their area providing a combination of behavioural and pharmacological support (Nicotine Replacement Therapy (NRT), Bupropion (Zyban®) and Varenicline (ChampixTM)). Services are delivered in the format of group sessions or one to one, depending on the local circumstances and client's preferences. Most stop smoking advisers are nurses or pharmacists, and all have received training for their role. Smokers can self refer to the stop smoking service, or be referred on by any professional in charge of their care. Smoking Cessation Services record the number of people successfully quitting through the support of their service. To be counted as a success, a patient must be quit at four weeks which is validated by a CO reading. During the four weeks, a quitter is allowed small lapses for the first two weeks, but must not have a single puff for the remaining two. Table 9.7 compares the latest quitting figures available by PCT.
Table 9.7: Quitting figures for stop smoking services of PCTs in the West Midlands, April-September, 2006, pre- 2006 boundaries (old PCTs)
|

To access more information about the stop smoking services you can visit the following website: www.gosmokefree.co.uk
Non-governmental organisations
Additional to government services, there are also a series of NGOs that are heavily involved in issues surrounding tobacco control. Their websites are listed below:
http://www.bupa.co.uk/health_information/asp/healthy_living/lifestyle/smoking/ |
9.10 Main Messages
- In the UK, smoking kills about 106 000 people per year which is more than 12 deaths per hour. It is responsible for half of the deaths of all those who continue to smoke, and a half of these deaths occur before the age of retirement.
- Stopping smoking at any time after any length of time of smoking will benefit health and if a person quits soon enough there is still chance for their risk of developing a fatal disease to reduce to that of a non-smoker.
- Smoking data is collected through national surveys, which give direct estimates of smoking prevalence for the nation and the West Midlands as a whole. According to the General Household Survey 2005, prevalence of smoking in the West Midlands was just below the national prevalence of 24%, at 22%.
- Nationally, you are most likely to smoke if you are male, between the age of 20-34 years, have a manual job and are of a mixed ethnic background. The West Midlands is likely to mirror these trends.
- There are 78 attempts / 100 smokers / year to quit smoking in the UK but the majority of those attempts fail.
- Unaided, 4-5 % of people will successfully quit.
- With help, the success rate increases. The NHS runs local smoking cessation clinics which quadruple the quit rate compared to the unaided quit rate. Smoking cessation services combine behavioural and pharmacological (NRT/Buproprion/Varencline) support.
- There is still much work to be done to permanently reduce smoking prevalence, the story will not end with the enforcement of the 1st of July smoking ban in public places. The most effective way to give up is with help, and increase of access to NHS smoking cessation services is needed.
References:
- Aveyard P. Smoking Cessation. BMJ Health Intelligence 2007Accessed 25/06/2007Available from: URL: http://healthintelligence.bmj.com/hi/do/public-health/topics/content/smoking-cessation/index.html
- Secetary of State for Health. Smoking kills - A white paper on tobacco. 1998. The Stationary Office.
- Twigg L, Moon G, Walker S. The Smoking Spidemic in England. Health Development Agency 2004
- Eileen Goddard. General Household Survey: Smoking and Drinking among adults, 2005. The Information Centre 2005
Available from: URL: http://www.statistics.gov.uk/downloads/theme_compendia/GHS05/GHS2005_SmokingandDrinking_Report.pdf
- The Health Consequences of Smoking: A report of the Surgeon General. Atlanta,Ga.: US Department of Health and Human Services,Centres for Disease Control and Prevention,National Centre for Chronic Disease Prevention and Health Promotion. 2004. Office on Smoking and Health.
- Peto R, Doll R. The hazards of smoking and the benefits of stopping. In: Bock G, Goode J, editors. Understanding nicotine and tobacco addiction.Chichester: John Wiley & Sons; 2006. p. 3-28.
- Samet JM. The health benefits of smoking cessation. Med Clin North Am 1992 Mar;76(2):399-414.
- Samet JM. The health benefits of smoking cessation. Med Clin North Am 1992 Mar;76(2):399-414.
- Doll R, Peto R, Boreham J, Sutherland I. Mortality in relation to smoking: 50 years' observations on male British doctors. BMJ 2004 Jun 26;328(7455):1519.
- The health consequences of smoking. A report of the Surgeon General. http://www cdc gov/tobacco/sgr/sgr_2004/chapters htm 2004
- McEwan A, Hajek P, McRobbie H, West R. Manual of Smoking Cessation: A Guide for Counsellors and Practitioners. Blackwell Publishing; 2006.
- Doll R, Peto R, Boreham J, Sutherland I. Mortality in relation to smoking: 50 years' observations on male British doctors. BMJ 1937;2004 Jun 26; 328(7455):1519-28.
- The health consequences of smoking. A report of the Surgeon General. http://www.cdc.gov/tobacco/sgr/sgr_2004/chapters htm 2004
- Lumley J, Oliver S, Waters E. Interventions for promoting smoking cessation during pregnancy (Cochrane Review). In: The Cochrane Library, Issue 1, 2003
- Lopez AD, Collishaw NE, Piha T. A descriptive model of the cigarette epidemic in developed countries. Tob Control 1994 Sep 1;3(3):242-7.
- West R. Feasibility of a national longitudinal study ('The Smoking Toolkit Study') to monitor smoking cessation and attempts at harm reduction in the UK. Internet 2006Available from: URL: www.smokinginengland.info/Ref/stp001.pdf
- Anonymous. Statistics on smoking in England. London: Office for National Statistics; 2007.
- Blakely T, Wilson N. The contribution of smoking to inequalities in mortality by education varies over time and by sex: two national cohort studies, 1981-84 and 1996-99. Int J Epidemiol 2005 Oct 1;34(5):1054-62.
- Laaksonen M, Roos E, Rahkonen O, Martikainen P, Lahelma E. Influence of material and behavioural factors on occupational class differences in health. J Epidemiol Community Health 2005 Feb 1;59(2):163-9.
- Fidler J. Identifying protective and risk factors for smoking: a cohort study following 5000 teenagers from 11-16. London: UCL; 2006.
- Taylor T, Lader D, Bryant A, Keyse L, Joloza MT. Smoking-related behaviour and attitudes, 2005. London: Office for National Statistics; 2006.
- West R. Background smoking cessation rates in England. http://aspsilverbackwebsites.co.uk/smokinginengland/ref/paper2.pdf 2006:1-3.
- West R. Smoking and smoking cessation in England, 2006. http://www.smokinginengland.info 2006:1-4.
- Jarvis MJ, Wardle J, Waller J, Owen L. Prevalence of hardcore smoking in England, and associated attitudes and beliefs: cross sectional study. British Medical Journal 2003;326:1061
- Hughes JR, Keely J, Naud S. Shape of the relapse curve and long-term abstinence among untreated smokers. Addiction 99, 29-38. 2004.