West Midlands Key Health Data 2006/07
CHAPTER TWELVE: MATERNITY SERVICES IN THE WEST MIDLANDS
Elaine Kidney, Professor Christine MacArthur, Dr Heather Winter and Gavin Rudge
Main Body
7: Childhood Obesity Monitoring And Prevention Research
8: Treatment For Drug Misuse In The West Midlands 2005/6
9: Smoking And Smoking Cessation: Health Efects And Prevalence Trends
12.1 Introduction
Maternity services are a key public health measure to improve health and reduce inequalities, seen by Government as in need of modernisation. Various current documents and policies relate to maternity services, particularly the Maternity Standard of the National Service Framework for Children, Young People and Maternity Services (1) and NICE guidelines. The overall vision of the NSF is:
- Flexible, individualised services designed to fit around the needs of the mother and her baby’s journey through pregnancy and motherhood, with emphasis on the needs of vulnerable and disadvantaged women
- Women being supported and encouraged to have as normal a pregnancy and birth as possible, with medical intervention only if it is of benefit
- Midwifery and obstetric care based on providing good clinical and psychological outcomes for the woman and her baby, while putting equal emphasis on preparing new parents for parenthood
A project on research dissemination in maternity services in the region (2) identified a number of current concerns within PCTs and found that maternity services did not yet meet many aspects of the NSF. PCTs’ main concerns were:
- Management/organisation of services:
- Provision of optimum levels of care – what are the most effective models of maternity care, taking account of shortages of midwives, and effective deployment of maternity assistants
- Improvements in basic care, particularly in areas with high maternity caseloads
- Improving access to midwifery care, especially via community services.
- Changing practice to work with multidisciplinary teams, for instance in Sure Start Children’s Centres
- Relationships/contracts/networks between purchasers and providers.
- Improving services for particular vulnerable groups eg ethnic groups, particularly those who either do not speak English, have different cultural expectations of care or who access the service late, those subject to domestic abuse and women with disabilities
- Meeting targets for increasing breastfeeding and decreasing smoking levels, and how to achieve these
- Specific concerns such as high levels of perinatal and infant mortality in some areas and high levels of caesarean section in others
This chapter provides a snapshot of current maternity services in the West Midlands, where data is available, relating to booking for antenatal care; disadvantaged groups; smoking in pregnancy; breastfeeding initiation and caesarean section rates. There are no data to present on most aspects relevant to PCTs’ concerns about organisation of services. Links between maternity services and infant outcome are covered extensively by the West Midlands Perinatal Institute (WMPI) and are not included in this chapter.
12.2 Data Used in this Chapter
This chapter collated data from a number of sources, using the most up-to-date figures available to us. Hospital Episode Statistics (HES) are collected when patients are admitted to consultant care and for maternity patients we have used these data to show numbers of births, maternal characteristics and hospital stay. In the case of maternity admissions however, some very useful information about the birth is collected in a subset of the main dataset termed the “maternity tail”. For a variety of technical reasons many units are unable to capture information in the ‘tail’, such that it can be incorporated into the national database. The analyses presented here do not use data items captured in this part of the data set. The extent to which tail data are available is shown in Figure 12.1. Complete data could inform Local Delivery Plans as recommended by a 2003 House of Commons Health Report (3).
Local Delivery Plan Returns (LDPR) contain data on breastfeeding and smoking cessation submitted quarterly by PCTs to the Healthcare Commission. There are a number of gaps in the LDPR. These are where data did not meet Department of Health quality standards, eg no more than 5% of numbers unknown. Registration information, such as that derived from the Office of National Statistics, provide a third source of data, while some results from the 2006 survey by the National Perinatal Epidemiology Unit (NPEU) and the Infant Feeding Survey 2005 (IFS)(a) have been included to provide a fuller picture.
(a) Copyright © 2007, Re-used with the permission of The Information Centre. All rights reserved.
Figure 12.1: Percentage of HES maternal episode data with maternity tail, by provider (b)
|

(b) (BLT) Birmingham, Lichfield and Tamworth PCT was a provider of maternity services a well as a purchaser
12.3 Maternity Service Provision in the West Midlands
According to ONS data, the birth rate has been rising since 2001. 65,956, one tenth of the 645,835 live births in England and Wales in 2005/6, were in the West Midlands. Provisional figures for 2006 show the West Midlands to have the highest total fertility rate (c) (1.97 children per woman) and 2nd highest general fertility rate (d) (62.2 live births /1000 women of childbearing age) in England and Wales (3).
HES contains records of 63,748 deliveries, resulting in 64,087 births 146,943 West Midlands obstetric-related hospital episodes in 2005/6. There were 63,034 singleton births, 1,026 twins, and 27 triplets. LDPR data for breastfeeding and smoking rates record the following numbers of maternities: 55,954 in 2003/4, 56,049 in 2004/5 and 56,330 in 2005/6. Over 98% of all births occurred in regional hospitals, with less than 2% of home births and around 0.1% outside the region.
Nationally, there were increases in maternities in all ages, with the highest percentage increase among women between 35 and 39 years old (7%). Other national trends were increases in the number of babies born to women aged 40 or over, and the proportion of births to women born outside the UK (ONS).
The maternal age profile the West Midlands is shown in Figure 12.2 (source: HES). 8% of births were to teenagers.
(c) The total fertility rate (TFR) is the average number of children that would be born per woman if women experienced the age-specific fertility rates of the year in question throughout their childbearing lifespan.
(d) The general fertility rate (GFR) is the number of live births per 1,000 women aged 15-44
Figure 12. 2: Maternal age profile of women in the West Midlands
|

12.4 Early Access to Maternity Services among Vulnerable Groups
A key theme of the Maternity Standard of the NSF is to improve the service by making it more accessible, particularly to groups of vulnerable women. Women should be able to access maternity services directly, by 8-10 weeks of pregnancy.
Within the West Midlands women from more deprived backgrounds tend to access the service later than more affluent women (Figure 12.3). Similarly, women from ethnic minority backgrounds tend to access the service later than British white women (Figure 12.4).
Figure 12.3: Comparison of attendance for antenatal care in West Midlands during first trimester, by deprivation (Townsend quintiles)
|

Figure 12.4: Comparison of attendance for antenatal care in West Midlands during first trimester, by ethnic group
|

Early attendance enables earlier screening and testing and opportunity to provide beneficial interventions such as folic acid and smoking cessation. Services may need to target appropriate communities so that women from more deprived backgrounds and diverse ethnic groups come forward for earlier booking.
12.5 Smoking in Pregnancy
Cigarette smoking is a modifiable risk behaviour consistently shown in epidemiological studies to reduce birth weight and increase perinatal mortality. Numerous trials have examined the effects of a range of smoking cessation interventions and a Cochrane review found a significant reduction in the proportion of women continuing to smoke(4). The relative risk, based on 38 trials and 12,168 women was 0.94, (95% CI 0.93-0.95), which is an absolute difference of 6 in 100 women continuing to smoke. There was a significant reduction in low birth weight, based on 13 trials, 8930 women and 658 events, with a relative risk of 0.81 (95% CI 0.70-0.94); and a significant reduction in preterm birth, based on 11 trials, 10,932 women and 629 events, with a relative risk of 0.84 (95% CI 0.72-0.98). The difference in mean birth weight was 33g (95% CI 11g-55g). There were insufficient numbers, thus inadequate power, to be able to detect significant differences in very low birth weight (<1500g) or perinatal mortality.
Figure 12.5: Smoking rates at end of pregnancy in the West Midlands by PCT, pre-2006 boundaries
|
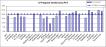
Figure 12.5 shows variation in smoking levels at the end of pregnancy across the West Midlands, based on PCTs prior to reorganisation in October 2006. According to the local LDPR figures for 2005/6, the highest proportion of mothers who smoked throughout pregnancy were in Wolverhampton, Redditch and Bromsgrove and South Worcestershire. Heart of Birmingham had the lowest levels. Figure 12.5 shows a slight decrease in smoking rates in pregnancy over the last three years for most PCTs.
Figure 12.6: Smoking prevalence at end of pregnancy, 2004/5-2006/7 by new PCT boundaries
|
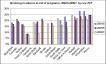
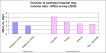
Data from the IFS 2005 (Figure 12.7 to 12.10) show that women from routine and manual socioeconomic backgrounds and younger women are more likely to smoke and less likely to quit smoking during pregnancy than women from other groups (5).
Figure 12.7: Smoking throughout pregnancy by socio-economic group in England & Wales
|
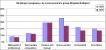
Figure 12.8: Smoking cessation in pregnancy, by socio-economic group
|
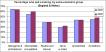
Fig 12.9: Smoking throughout pregnancy, by age group
|
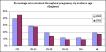
Figure 12.10: Smoking cessation in pregnancy, by age group
|
These data would support continued efforts to reduce smoking, especially among younger women and those living in more deprived areas.
12.6 Breastfeeding Initiation
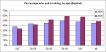
The benefits of breastfeeding in promoting health and preventing disease in both the short and long term, for both mother and infant have been well-documented in many studies, yet initiation and continuation in the UK are around the lowest in Europe (6). LDP returns (Figure 12.11) show that breastfeeding initiation rates across the West Midlands (2005/6) are slightly lower than the England average, although there is some concern about the definition of “initiation of breastfeeding”.
Figure 12.11: Breastfeeding initiation rates across the West Midlands compared to rest of England
|
Figures 12.12 to12.14 show initiation rates within the three former West Midlands SHAs from 2003/4 to the first quarter of 2006/7, according to previous PCT boundaries. The highest rate in the region was Herefordshire. Generally, increases in breastfeeding rates have been low, particularly in areas starting from a low base.
Figure 12.12: Breastfeeding initiation rates across the former West Midlands South Strategic Health Authority area, 2003/4 to 1st quarter 2006/7
|

Figure 12.13: Breastfeeding initiation rates across the former Shropshire and Staffordshire Strategic Health Authority area, 2003/4 to 1st quarter 2006/7
|

Figure 12.14: Breastfeeding initiation rates across the former Birmingham and the Black Country Strategic Health Authority area, 2003/4 to 1st quarter 2006/7
|

Data from the Infant Feeding Survey 2005 (7) show that women are more likely to breastfeed if they belong to higher socio-economic groups, have completed more years of education, are older, or are first time mothers (Figure 12.15 -12.18).
Figure 12.15: Breastfeeding initiation rates, by socio-economic group
|
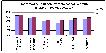
Figure 12.16: Breastfeeding initiation rates, by age at completion of education (England, 2005)
|

Figure 12.17: Breastfeeding initiation, by mothers age (England 2005)
|
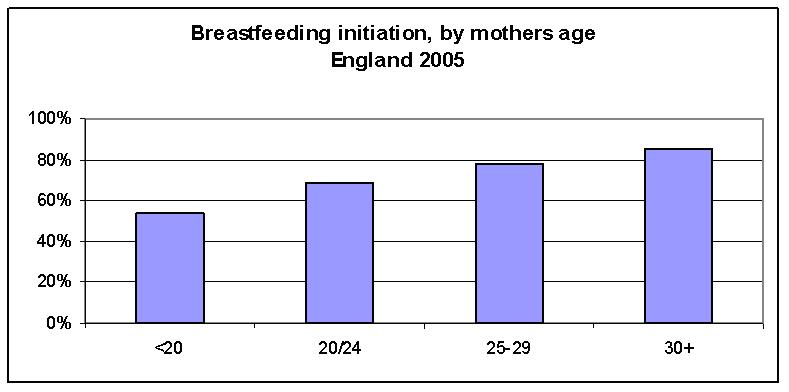
Figure 12.18: Breastfeeding initiation, by birth order
|

PCTs with poor breastfeeding initiation rates may consider ways to increase rates, including requesting their providers to implement an externally evaluated programme such as the Baby Friendly Initiative, especially among younger women and those living in deprived communities. Good data on duration of breastfeeding are often not provided.
12.7 Caesarean Section Rates
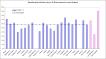
The proportion of women having a spontaneous vaginal delivery has reduced. In line with national trends, local rates of caesarean sections in obstetric units have risen in the last 15 years (Figure 12.19 to 12.21). In 2005, the Worcestershire Royal and Alexandra (29%), New Cross (27%) and Walsgrave (27%) hospitals had around double the rate of the Royal Shrewsbury (14%).
Figure 12.19: Caesarean rates by provider across previous West Midlands South Strategic Health Authority,1990-2005
|

Figure 12.20: Caesarean section rates by provider, across previous Birmingham and Black Country Strategic Health Authority,1990-2005
|
Figure 12.21: Caesarean section rates by provider across the previous Shropshire and Staffordshire Strategic Health Authority, 1990-2005
|
According to a survey by the NPEU (7), the most frequent reason for a caesarean section in primiparous women is failure to progress/disproportion (57.8%) but in multiparous women the biggest cause is previous caesarean section (45.7%).
12.8 Postnatal Services
Figure 12.22 shows a large drop over the last 30 years in length of time spent on the postnatal ward. Around 80% of women stay for less than 3 days.
Figure 12.22: Length of postnatal hospital stay, England (1975 to 2005)
|
15% of women in the West Midlands stay for less than one day and a further 37% stay less than two days (Figure 12.23). A Cochrane review found the impact of reduced stay for healthy mothers and term infants to be inconclusive, with no evidence of adverse outcomes but methodological limitations of included studies meant that adverse outcomes could not be ruled out (8). Unsurprisingly, women who have had caesarean sections tend to have longer hospital stays (Figure 12.24). Early discharge in the UK takes place in the context of midwifery support at home.
Figure 12.23: Mean length of hospital stay in the West Midlands
|
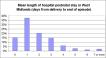
Figure 12.24: Mean length of hospital stay by parity and by type of birth (England,2005)
|
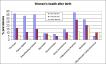
Our own set of studies show that maternal ill heath following childbirth is common, can affect the quality of women’s lives and is often undetected by health professionals (9;10). The NPEU survey (Figure 12.25) shows these morbidities are still prevalent and persistent. As higher prevalence rates have been shown in several other studies, eg postnatal depression of 13%(11), these morbidities appear to be a minimal estimate.
Figure 12.25: Womens health after birth
|
Postnatal health has had a low priority in recent years but there is good evidence that an improved universal service with emphasis on individual needs based care can be provided with little or no budgetary impact (12;13) as recommended by NSF and NICE guidelines
12.9 Conclusion
With over 65,000 women delivering in the region each year, maternity services are vital. Maternity services are seen by Government as a key public health measure to improve health and lower inequalities.
References:
- Department of Health. Maternity Standard, National Service Framework for Children, Young People and Maternity Services. London: Department of Health; 2004
- Kidney E, MacArthur C, Winter H, Maternal and Child Epidemiology team. Research-based evidence and good practice in maternity services. 2006.
- Office for National Statistics. Live Births Fertility highest for 26 years. Office for National Statistics 2007 [cited 2007 Jun 22];
Available from: URL: http://www.statistics.gov.uk/CCI/nugget.asp?ID=369&Pos=4&ColRank=2&Rank=672
- Lumley J, Oliver S, Chamberlain C, Oakley L. Interventions for promoting smoking cessation during pregnancy. The Cochrane Database of Systematic Reviews 2004;(4):Art. No.: CD001055. DOI: 10.1002/14651858.CD001055.pub2.
- Bolling K, Grant C, Hamlyn B, Thornton A. Infant Feeding Survey 2005. The Information Centre; 2007.
- Renfrew MJ, Dyson L, Wallace L, D'Souza L, McCormick F, Spiby H. The Effectiveness of Public Health Interventions to Promote the Duration of Breastfeeding: Systematic Review. NICE 2005;1st Edition.
- Redshaw M, Rowe R, Hockley C, Brocklehurst P. Recorded delivery: a national survey of women's experience of maternity care 2006. Oxford: National Perinatal Epidemiology Unit; 2007.
- Brown S, Small R, Faber B, Krastev A, Davis P. Early postnatal discharge from hospital for healthy mothers and term infants. Cochrane Database of Systematic Reviews 2002;(Issue 3Art. No.: CD002958..): DOI: 10.1002/14651858.CD002958.
- Bick D, MacArthur C. The extent, severity and effect of health problems after childbirth. British Journal of Midwifery 1995;3:27-31.
- MacArthur C, Lewis M, Knox E. Health After Childbirth. BJOG 1991;98:1193-5.
- O'Hara MW. Rates and risk of postpartum depression-A meta-analysis. International Review of Psychiatry 1996;8(1):37-54.
- MacArthur C, Winter H, Bick D, Knowles H, Lilford R, Henderson C, et al. Effects of redesigned community postnatal care on womens' health 4 months after birth: a cluster randomised controlled trial. The Lancet 2002 2002 Feb 2;359:378-86.
- MacArthur C, Winter H, Bick DE, Lilford RJ, Lancashire R, Knowles H, et al. Redesigning postnatal care: randomised trial of protocol-based midwifery-led care focused on individual women's physical and psychological health needs. Health Technology Assessment 2003;7(37).
For more information please contact Sarafina
Cotterill
© Department
of Public Health and Epidemiology, University of Birmingham