West Midlands Key Health Data 2007/08
CHAPTER NINE: STROKE IN THE WEST MIDLANDS
Stacey Croft, Dr Kristina Routh and Dr Helen Carter
Main Body
7: Healthcare Associated Infections (HCAI)
9.1 Introduction
Stroke is the third largest cause of death in England with more than 110,000 people experiencing a stroke each year. Between 20 and 30 per cent of people who have a stroke die within a month. Stroke causes considerable morbidity with approximately half of the individuals who have had a stroke relying upon others for activities of daily living and it is the single biggest cause of severe disability in the UK.(1,2)
A stroke occurs when the blood supply to the brain is disrupted. There are two main types of stroke:
- Ischaemic, where the blood supply is blocked as a result of a clot or a narrowing of the blood vessel
- Haemorrhagic, where there is a bleed inside the brain.
The onset of a stroke is sudden and symptoms can include numbness, weakness or paralysis of limbs, slurred speech, loss of vision and alteration of level of consciousness. A transient ischaemic attack (TIA or ‘mini-stroke’) occurs when the symptoms of the stroke last less than 24 hours.
Stroke, like many other vascular diseases is, to some extent, preventable. A major risk factor is increasing age, but a quarter of strokes occur in those aged under 65. Other risk factors include hypertension (high blood pressure), smoking, lack of exercise, obesity, high alcohol intake, high cholesterol, atrial fibrillation (irregular heart beat), diabetes and a previous TIA. It is more common in African-Caribbean males and in South Asians. People in socio-economic group V (unskilled manual workers) have a 60% higher stroke risk than those in group I (professionals).(3)
Stroke was included in the National Service Framework for Older People with the aim of reducing the incidence of stroke in the population and ensuring that those who have had a stroke have prompt access to integrated stroke care services.(4) The National Stroke Strategy was released in 2007. One of the aims of this strategy is to alter the perception of stroke from an inevitable consequence of aging to a condition that is preventable and, if diagnosed early enough, treatable through advances in modern medicine such as thrombolysis. The strategy contains 20 quality markers encompassing prevention, first contact, treatment, rehabilitation and long-term support. It also aims to increase the public’s awareness to encourage early recognition of the signs of stroke and improvement in access to the appropriate services.(2)
This chapter aims to describe the pattern of mortality and morbidity of stroke across the West Midlands. We include data on hospital admissions together with some indicators of quality of care in the region from Primary and Secondary Care.
9.2 Mortality
In early 2008 the West Midlands Public Health Observatory, on behalf of the Association of Public Health Observatories, produced a report Indications of Public Health in the Regions: Older people which included information on stroke.(5) This report showed that the West Midlands has the highest mortality for stroke in England in people over 65.
Mortality rates are associated with both incidence and survival rates, hence variations in these rates will cause variation in mortality. Differences in incidence of stroke are the result of differences in the prevalence of underlying risk factors including lifestyle (e.g. smoking, poor diet and obesity) and the demography of the population such as age, ethnicity and socio-economic make up. Survival rates may be influenced by variations in the case-mix (e.g. age, severity and other illnesses) and also by the quality of care stroke patients receive. Differences in the ways data is recorded, its completeness and accuracy may result in perceived differences which are not necessarily correct. In all these instances there is also the play of chance, leading to inherent natural variation.(6)
Information about mortality from stroke is publicly available from the National Centre for Health Outcomes Development (NCHOD, www.NCHOD.nhs.uk). NCHOD was created in 1998 as a national repository for health information using data from ONS. For this chapter mortality data has been sourced from ONS and analysis produced by the West Midlands Public Health Observatory. Stroke has been identified by the International Classification of Diseases tenth edition (ICD-10 I60-I69), this may differ to definitions used elsewhere.
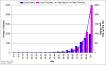
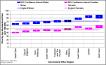
Mortality from stroke increases dramatically with increasing age. For England the overall mortality rate from stroke in 2004-2006 was 53 per 100,000, the rate in people aged over 75 (949 per 100,000) is nearly 60 times greater than in under 75’s (16 per 100,000). In terms of potential years of life lost the under 75 years age group are a very important group. For the purposes of this chapter we will be mainly concentrating on those aged under 75 years.
Figure 9.1: Age Profile of Stroke (ICD10 I60-I69) Mortality in the West Midlands, deaths registered 2004-06
|
Mortality for all ages in the West Midlands was 58.4 per 100,000, the 3rd highest of nine Government Office Regions (GOR) in 2004-06. For the under 75 years age group the West Midlands is also 3rd highest region in terms of mortality. Directly Standardised Rates by GOR show that there is a clear north-south gradient when comparing mortality for stroke, as shown in figure 9.2. Mortality rates for men aged under 75 are significantly higher than the corresponding rates in women, for the West Midlands males have a rate of 21.5 per 100,000 and females 15.2 per 100,000. Consequently, where possible, persons rates used in this chapter have been age and sex standardised.
Figure 9.2: Under 75s Stroke (ICD10 I60-I69) Mortality Rates by Government Office Region, deaths registered 2004-06
|
Directly Standardised Mortality Rates (DSRs) are also available by Primary Care Trust (PCT) for the West Midlands, Map 9.1 shows a map of these rates in the under 75s. Heart of Birmingham, Sandwell and Birmingham East & North PCTs (27.8, 25.8 and 23.4 per 100,000 respectively), are statistically significantly higher in comparison to the West Midlands rate. In comparison Worcestershire and Warwickshire have significantly lower rates in the under 75s (14.3 and 14.5 per 100,000).
Map 9.1: Under 75s Stroke (ICD10 I60-I69) Mortality Rates in the West Midlands by Primary Care Organisation, deaths registered 2004-06
|

The DSRs reported here do not take into account the differing ethnicity and socio-economic demography of the PCTs and regions which could account for some of the observed variation of rates because of the prevalence of underlying risk factors.
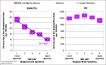
Mortality due to stroke in the West Midlands shows a strong association with deprivation in the under 75 years age group (R2=0.97). Rates in the most deprived areas of the West Midlands are nearly 3 times higher than those in the least deprived areas. This relationship is clearly absent in the over 75 year age group (see Figure 9.3). This pattern is observed in both males and females.
Figure 9.3: Stroke (ICD10 I60-I69) Mortality Rates in the West Midlands by Deprivation, deaths registered 2004-06
|
Comparison of stroke mortality rates for under 75’s in 2001-03 to 2004-06, shows that the gap
between the West Midlands and England has widened slightly to 2.4 per 100,000. Conversely for mortality in the over 75s the gap has narrowed from 96.0 per 100,000 in 2001-03 to a difference of 69.5 per 100,000 in 2004-06 (Figure 9.4).
Figure 9.4: Stroke (ICD10 I60-I69) Mortality Rates in the West Midlands, deaths registered 2001-03 vs. 2004-06
|
Mortality from stroke has been decreasing over the last 30 years in developed countries and Carroll et al suggest that mortality is no longer a good marker to measure the burden of the disease.(3)
9.3 Morbidity - Hospital data
Hospital Episode Statistics (HES) is a data warehouse containing details of all admissions to NHS hospitals in England. It includes private patients treated in NHS hospitals, patients who were resident outside of England and care delivered elsewhere funded by the NHS (www.HESonline.nhs.uk). Inpatient data is available for every financial year from 1989/90. Healthcare providers submit data via the secondary users service (SUS). The HES data is validated, cleaned and processed by the Information Centre for Health and Social care.
Stroke has been defined by ICD10 I60-I69, for consistency with the mortality data shown earlier. The admissions data presented in this chapter is for counts of first finished consultant episodes, in financial year 2006/07. This is a crude proxy for the number of patients with a diagnosis, although patients may be admitted more than once.
Looking at emergency admissions for stroke helps us to gain some information about incidence, as these admissions are most likely to be associated with the onset of a new stroke. However, we know that not all who suffer from a stroke will be admitted to hospital – some will be managed in primary care with outpatient secondary care and so will not appear in HES data.
Figure 9.5: Under 75s Stroke (ICD10 I60-I69) Emergency Admission Rates by Government Office Region, financial year 2006/07
|
Whilst the West Midlands mortality rate in the under 75s is above the England average, the West Midlands emergency admissions are not dissimilar to England as a whole. The region is fourth highest of the GORs for both all ages and under 75’s. Similar to mortality, emergency admission rates for stroke are higher in men than women. In the West Midlands men under 75 have an emergency admission rate of 71.7 per 100,000, the rate for women under 75 is 49.1 per 100,000.
Map 9.2: Under 75s Stroke (ICD10 I60-I69) Emergency Admission Rates in the West Midlands by Primary Care Organisation, financial year 2006/07
|

The rates of stroke emergency admissions in the under 75’s by PCT are similar in distribution to mortality rates; Sandwell (82.0 per 100,000) and Heart of Birmingham (92.9 per 100,000) PCTs were significantly higher whilst Worcestershire PCT (48.0 per 100,000) was significantly lower than the West Midlands average. These admission rates show a strong correlation with deprivation (R2=0.97) (Figure 9.6). In 2006/07 the most deprived fifth of areas in the West Midlands, by IMD 2007 England rank, had an emergency admission rate of 78.4 per 100,000, nearly double the rate in the least deprived fifth of areas (42.8 per 100,000).
Figure 9.6: Stroke (ICD10 I60-I69) Emergency Admission Rates in the West Midlands by Deprivation, financial year 2006/07
|
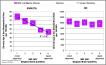
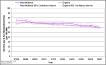
Figure 9.7 shows the decreasing trend in emergency admissions in the under 75’s between 1997/98 to 2006/07, for the West Midlands and England. The West Midlands has experienced a reduction of 20% over this time, from 75.4 per 100,000 to 60.4 per 100,000.
Figure 9.7: Under 75s Stroke (ICD10 I60-I69) Emergency Admission Rates in the West Midlands and England, financial years 1997/98 2006/07
|
A more timely source of HES data is the Commissioning Business Support Agency (CBSA, http://www.wmcbsa.nhs.uk/), established in the West Midlands in April 2007. It supports PCTs’ commissioning processes through providing accurate and timely contract management information. The CBSA have a data warehouse that holds HES data with only approximately 2 weeks time delay. Data held by the CBSA is for people registered with GPs in the West Midlands. It therefore differs from the data presented in this chapter which is for residents, as well as by the methods used to extract, clean and process these data.
Historically, individuals with an acute stroke may not have been referred to hospital but cared for within the community or nursing homes. Following the release of the stroke strategy this practice should change with stroke being viewed as a “brain attack” calling for rapid access to hospitals for assessment for thrombolysis. This may lead to an increase in the numbers of stroke patients being admitted to hospitals, and thus an apparent increase in incidence of stroke if gauged by this measure.
Stroke patients may also be seen in outpatient clinics rather than be admitted to hospital following their first stroke. This data will not be captured in the HES inpatient data. Stroke care can come under the remit of general physicians, geriatricians, neurologists and vascular surgeons.
Data previously available from aggregate returns has been released as an ‘experimental’ HES outpatient dataset available from 2003/04 (www.HESonline.org.uk). Many of the items in this dataset form part of the national Commissioning Data Set (CDS). Unlike HES inpatient data, which can currently record up to 14 diagnostic codes, the current version of the Outpatient Attendance CDS cannot carry more than two diagnosis codes per patient attendance. Diagnosis is not a mandatory item in the Outpatient CDS.(8) Stroke outpatient care is therefore incompletely recorded so we are unable to determine the number of individuals seen in outpatients if not admitted as an inpatient for investigation following a stroke.
9.4 Morbidity - Prevalence
Information relating to the prevalence of stroke and TIA can be obtained from registers held by each General Practice in England through the Quality and Outcomes Framework (QOF). The Quality Management and Analysis System (QMAS) is the national system used to calculate QOF achievement for each practice. QOF data is publically available from the Information Centre for Health and Social Care (http://www.ic.nhs.uk) and supplies QOF data for use on the NCHOD website.
The reliability and validity of this information depends upon a number of factors including the individual’s (or their carers) health seeking behaviour, stroke and TIA being recognised and diagnosed by the health professional and the data being recorded accurately. It must be remembered that QOF data is collected for the purposes of measurement and improvement of quality of care, not for the study of the population’s health. Limitations include the lack of a standardised disease definition, underlying differences in demography of the practice population and the variation between practices in the diagnosis and treatment recording and coding using the practice clinical information system. A previous chapter of Key Health Data has highlighted the fact that prevalence of disease (in that case coronary heart disease) as measured by QOF, may be much lower than expected from other clinical indicators such as mortality rates.(9)
Figure 9.8: Stroke and TIA prevalence (STR1) by Strategic Health Authority, financial year 2006/07
|
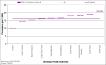
Prevalence of stroke and TIA for 2006/07 in the West Midlands Strategic Health Authority with a rate of 16.6 per 1,000, was the 6th highest of the 10 SHAs. However, the West Midlands is still very similar to the England average (16.1 per 1,000). This differs from mortality for which the West Midlands region was 3rd highest, however mortality includes only stroke (ICD10 I60-I69) whilst QOF prevalence includes both stroke and TIA. The prevalence of stroke and TIA by QOF does not show the clear north south gradient observed for mortality.
Map 9.3: Unadjusted Prevalence Rates of Stroke and TIA (STR1), in the West Midlands by Primary Care Organisation, Financial Year 2007/08
|

QOF data is available regionally for 2007/08 directly from the Quality Management and Analysis System (QMAS). With a prevalence of 16.7 per 1,000 the West Midlands has remained very similar to the previous year (16.6 per 1,000). The quality of the QOF data appears to be variable across the region. North Staffordshire, Shropshire County, and Herefordshire ranked highest in terms of QOF prevalence. The prevalence rate in Heart of Birmingham PCT is the lowest in the region, being an extreme contrast to both emergency admissions and mortality rates for all ages and under 75’s. Although this may be a result of greater access to services and lower survival, it is unlikely to represent a true picture, and may be due to under recording in the QOF data.
It must be noted that if the National Stroke Strategy is successful in achieving it’s aims of increasing the public’s awareness of stroke and TIAs then this may be captured in the QOF data showing an apparent increase in stroke occurring nationally.
9.5 Outcomes
The West Midlands has above average mortality for stroke for both all ages and under 75’s. Patients in the West Midlands appear to have poor survival from stroke. NCHOD data for all ages from 2005/06 ranks the West Midlands 2nd highest, after the East Midlands, for deaths within 30 days of emergency admission for stroke (indirectly age & sex standardised rate 24831.1 per 100,000), higher than but not statistically significant from the England average (23657.4 per 100,000). The region also has the lowest percentage of patients returning to their usual place of residence 52.3%, significantly lower than England average of 56.7% (indirectly age and sex standardised).(7) Although it should be noted this data is defined differently to earlier presented data, in terms of age group, year and ICD10 codes, and that it may not reflect long term outcomes. These data may indicate a need to examine the standard of care in the region.
9.6 Standard of Care - Primary Care
Quality of care for stroke in primary care can be assessed by looking at QOF data for treatment following initial diagnosis for those not admitted to hospital, and also levels of appropriate preventative care for those with previous stroke and TIA.
Please note previous caveats for QOF data. A further issue to take into account here is that practices are allowed, under certain circumstances, to remove patients from these returns – so called ‘exceptions’. The level of exceptions varies between practices.
Patients who have suffered a stroke require further investigation including imaging to determine if the stroke is haemorrhagic (due to a bleed) or ischaemic (due to a clot) because this has a major influence on future treatment with anti-coagulants. Figure 9.9 shows the results for the relevant QOF indicator by PCT in the West Midlands.
Figure 9.9: % of new patients with a stroke who have been referred for further investigation (STR11), in the West Midlands by Primary Care Organisation, financial year 2007/08
|
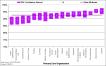
The percentage of stroke and TIA patients referred for further investigation ranges by 7 percentage points. North Staffordshire and Wolverhampton (89.1%) and Stoke on Trent (89.9%) were statistically significantly lower than the West Midlands average whilst Warwickshire (95.9%) and Solihull (96.1%) were significantly higher.
Preventative care involves preventing further strokes in those who have already suffered one by managing their risk factors. Those that are recorded through the QOF are blood pressure control, lowering of cholesterol and usage of anti-coagulation for non-haemorrhagic strokes (see Figures 9.10, 9.11 and 9.12).
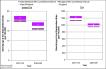
Figure 9.10: % of patients with TIA or stroke in whom the last blood pressure reading (measured in the previous 15 months) is 150/90 or less (STR6), in the West Midlands by Primary Care Organisation, financial year 2007/08
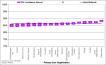
Figure 9.11: % of patients with TIA or stroke whose last measured total cholesterol (measured in the previous 15 months) is 5mmol/l or less (STR8), in the West Midlands by Primary Care Organisation, financial year 2007/08
|
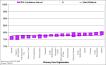
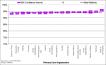
Figure 9.12: % of new patients with a stroke shown to be non-haemorrhagic, or a history of TIA, who have a record that an anti-platelet agent*, or an anti-coagulant+ is being taken (STR12), in the West Midlands by Primary Care Organisation, financial year 2007/08
|
Adequate control of blood pressure in those with stroke or TIA (Figure 9.10) varies across the West Midlands region from 85.0% in Wolverhampton and Solihull to 88.2% in Warwickshire, all significantly different to the regional average (86.4%). The only PCT significantly different from the West Midlands average for control of cholesterol was Walsall with 76.1%, significantly lower than the regional average (77.9%) (Figure 9.11).
Long-term anti-platelet therapy is prescribed as secondary prevention of recurrent stroke, reducing the risk of future serious vascular events. Little variation was seen across the region, with nearly all patients (excluding those subject to exception reporting) receiving this. Heart of Birmingham (96.0%) was significantly higher than the West Midlands average of 94.1% (Figure 9.12).
9.7 Standard of Care - Secondary Care
The Royal College of Physicians National Sentinel Audit of stroke(10) has taken place on a two-year cycle since 1998. The aim of the programme is to support local providers in the development of clinical audit as a tool for improving the quality of patient care. It contains two phases: organisation of care (Phase I) and process of care (clinical Phase II). The audit defined a site in the following way: “Lead clinicians were asked to collect data on the basis of a unified service within a Trust. For most Trusts the ‘site’ was the Trust. For some Trusts there were several ‘sites’ each offering a distinct service. A few other ‘sites’ were combinations of Trusts. There are some differences in configuration between the organisational audit (Phase I conducted in April 2006) and the clinical audit (Phase II).(10)
Phase I - organisation of care - has evolved over time and now contains 10 domains:
- Acute stroke care
- Organisation of care
- Interdisciplinary services (overall service)
- Interdisciplinary services (stroke unit)
- TIA/neurovascular services
- Continuing education in stroke
- Team working-multidisciplinary records
- Team working-team meetings
- Agreed assessment measures
- Communications with patients and carers.
Phase II - process of care - consists of a retrospective audit of patient records. Each hospital is required to review and submit data on at least 80 consecutive patients admitted with a diagnosis of stroke during a specified time period. The data collected allows comparisons of delivery of care with standards derived from critically appraised research evidence and agreed by experts in all disciplines involved with the management of stroke.
The 12 key standards are:
- More than 50% of stay on a stroke unit
- Screening for swallowing disorders within first 24 hours of admission
- Brain scan within 24 hours of stroke
- Commenced aspirin by 48 hours after stroke
- Physiotherapy assessment within first 72 hours of admission
- Assessment by an Occupational Therapist within 7 days of admission
- Weighed at least once during admission
- Mood assessed by discharge
- On antithrombotic therapy by discharge
- Rehabilitation goals agreed by the multi-disciplinary team
- Home visit performed before discharge
- Treated in a stroke unit during their stay
The report, National Sentinel Stroke Audit Phase I (organisational audit) 2006 Phase II (clinical audit) 2006 is available from the website of the Royal College of Physicians. Please note that the 2008 audit report will be available from February 2009.(10)
Six of the twenty-one sites in the West Midlands were reported as being in the top quartile for phase I of the audit (organisation of care) in 2006. These were the Heart of England NHS Foundation Trust, Mid Staffordshire General Hospitals NHS Trust, Royal Wolverhampton Hospitals NHS Trust jointly with Wolverhampton Health Care NHS Trust, University Hospital Birmingham NHS Foundation Trust, University Hospitals Coventry and Warwickshire (Walsgrave Hospital) and Walsall Hospitals NHS Trust.
Scores for phase II of the audit represent the average percentage compliance with the 12 key standards. Scores for Strategic Health Authorities in England ranged from 58 to 72% with an average of 65%. The West Midlands, at 63%, was below the national average and had the third lowest score.
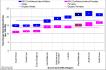
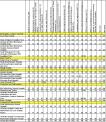
Twenty sites in the West Midlands participated in Phase II. Table 9.1 gives an example of the kind of data that is obtained through the audit, showing the percentage compliance with the phase II 12 key standards for sites within the West Midlands, organised by Stroke Network.
The authors of the audit report conclude:
“Stroke clinicians, managers and politicians can feel proud of the advances that have been made over the last ten years - there are few other conditions that have progressed as rapidly. However there are still many areas of care that need to be improved and some hospitals that have failed to recognise that their stroke patients need 21st century management.”
Table 9.1: Royal College of Physicians Stroke Sentinel audit - the percentage compliance with the phase II 12 key stroke standards for sites within the West Midlands, organised by Stroke Network, 2006.
|
9.8 Summary of findings in the West Midlands
Mortality due to stroke in the West Midlands is the third highest of all the nine Government Office Regions in the under 75s and in all ages. Mortality rates rise steeply with increasing age. In the West Midlands rates of emergency admission to hospital due to stroke in the under 75s are similar to those of England, even though mortality rates are higher in the region. In males, emergency admissions and mortality rates are 40% higher than in females in the West Midlands, in line with the rest of the country.
Mortality from stroke in the under 75s varies across West Midlands PCTs, with rates in Heart of Birmingham, Sandwell and Birmingham East & North being statistically significantly higher than the regional average, and Worcestershire and Warwickshire having rates which are significantly lower. These rates are, of course, influenced by the prevalence of underlying risk factors for stroke. Emergency admissions in PCTs across the region show a similar pattern to mortality rates, with Heart of Birmingham and Sandwell showing statistically significantly higher rates, and Worcestershire significantly lower.
In those under 75 both mortality and emergency admission rates show a correlation with deprivation. The most deprived fifth of the region having mortality rates nearly three times greater and emergency admissions rates nearly double that of the least deprived fifth. This relationship was absent for the over 75 age group.
Over the course of the last decade there was a reduction in emergency admissions to hospital nationally and in this region. The West Midlands saw a 20% reduction over this period.
Prevalence of stroke and TIA, as determined by the Quality and Outcome Framework (QOF) data, is 16.6 per 1,000 in the West Midlands. This is similar to the England average. Note that no north-south gradient is seen in QOF derived prevalence, unlike that seen in mortality due to stroke.
Across the region QOF derived prevalence varies significantly with North Staffordshire, Shropshire County and Herefordshire showing the highest rates. Heart of Birmingham has an extremely low prevalence of stroke and TIA reported through QOF, in contrast to their relatively high mortality and emergency admission rate.
The region has the lowest percentage of patients returning to their usual place of residence, and this is statistically significantly lower than the England average. For deaths within 30 days of admission the West Midlands has the second highest rate in England, although not statistically different from the England average.
Primary care quality of care for stroke patients as reported through the QOF varies across the region. The percentage of stroke and TIA patients referred for further investigation varies significantly from 89.1% in North Staffordshire and Wolverhampton to 96.1% in Solihull. Less variation is seen for the other QOF stroke and TIA indicators. Adequate control of blood pressure in those with stroke or TIA ranges from 85.0% in Wolverhampton and Solihull to 88.2% in Warwickshire, and successful lowering of cholesterol reporting ranges from 76.1% in Walsall to 79.5% in Solihull.
Information around the quality of secondary care for stroke in the region is available through, the two yearly, Royal College of Physicians Stroke Sentinel Audit. In the most recent audit, 2006, compliance with the 12 key standards varied between sites in the West Midlands and between standards. The West Midlands had six trusts in the top quartile for ‘organisation of care’, but had the third lowest score nationally for ‘process of care’.
9.9 Conclusions
Although emergency admissions in the under 75s for the West Midlands are in keeping with the national average, deaths from stroke in the West Midlands are higher than the England average. It is not clear whether this is due to the fact that more strokes are occurring in this age group with fewer than expected admitted to hospital or just that people who have strokes in the West Midlands are more likely to die.
Recording of data on the management of stroke in primary care requires some caution in interpretation and would benefit from improved quality of recording. However, current data from QOF and the Royal College of Physicians Stroke Sentinel Audit indicates that there is capacity for improvement in the management of stroke and TIA in primary and secondary care.
Twenty quality markers with which services can assess the quality of stroke, prevention, treatment, care and support and patient reported outcome measures have been suggested by the National Stroke Strategy. (2) It is hoped that this strategy will increase prevention, improve services and reduce mortality from stroke in the future.
References:
- National Audit Office, 2005, Reducing Brain Damage: Faster access to better stroke care, London, NAO. http://www.nao.org.uk/pn/05-06/0506452.htm, accessed 28.03.2008
- Department of Health 2007, National Stroke Strategy, http://www.dh.gov.uk/en/Publicationsandstatistics/Publications/PublicationsPolicyAndGuidance/DH_081062, accessed 28.03.2008.
- Carroll K., Murad S. and Eliahoo J. 2005. Stroke incidence and risk factors in a population-based prospective cohort study. Office for National Statistics,.
- Department of Health 2001, National Service Framework for Older People. http://www.dh.gov.uk/en/Publicationsandstatistics/Publications/PublicationsPolicyAndGuidance/DH_4003066, accessed 28.03.2008.
- Association of Public Health Observatories 2008, Indications of Public Health in the English Regions, 9: Older People.
- Mohammed M.A., Mant J., Bentham L. and Raftery J. Comparing processes of stroke care in high- and low-mortality hospitals in the West Midlands, UK. International Journal for Quality in Health Care 2005; Volume 17, Number 1: pp. 31-36.
- National Centre for Health Outcomes Development (NCHOD). http://www.nchod.nhs.uk, accessed 28.03.2008.
- Information Centre for Health and Social Care, Frequently Asked Questions about HRG4, http://www.ic.nhs.uk/our-services/standards-and-classifications/casemix/hrg4/frequently-asked-questions-about-hrg4, accessed 16.07.2008
- Wilson, R. 2005, Quality of Primary care and health inequalities in Key Health Data 2005, University of Birmingham, Chapter 2.
- Royal College of Physicians. National Sentinel Stroke Audit. Phase I (organisational audit) 2006. Phase II (clinical audit) 2006. Report for England, Wales and Northern Ireland. Prepared on behalf of the Intercollegiate Stroke Working Party by Clinical Effectiveness and Evaluation Unit Royal College of Physicians of London http://www.rcplondon.ac.uk/pubs/books/strokeaudit/, accessed 08.07.2008.
|
Appendix 1
Quality Outcomes Framework Stroke Indicators Publically Available Data Sources for 2006/07
* http://www.ic.nhs.uk/our-services/improving-patient-care/the-quality-and-outcomes-framework-qof-2006/07/qof-2006-07-data-tables
† Practice level: http://www.qof.ic.nhs.uk/, PCT and SHA data may be available upon request
‡ http://www.nchod.nhs.uk
|