West Midlands Key Health Data 2009/10
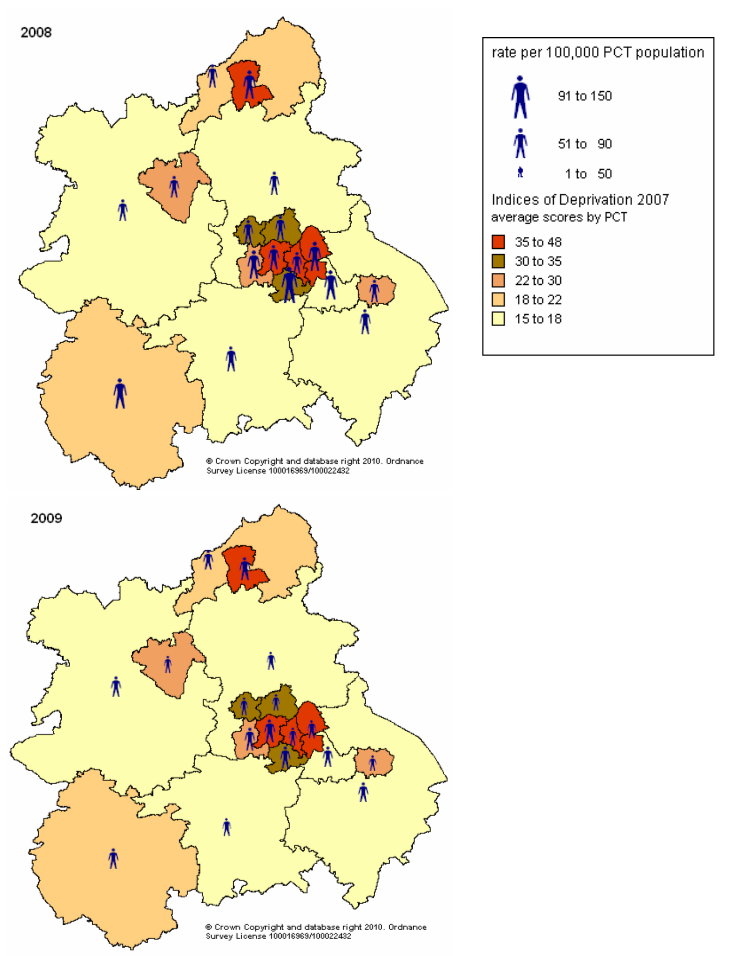
Maps 9.1a and 9.1b: Rates of CDI per 100,000 of West Midlands PCT population mapped against Indices of Deprivation. All positive CDIs reported on the HCAI Data Capture System for the relevant periods have been used for these calculations.
For more information please contact Sarafina
Cotterill
© Public Health, Epidemiology and Biostatistics Unit, School of Health and Population Sciences, University of Birmingham