West Midlands Key Health Data 2008/09
CHAPTER ONE: HEALTH GEOGRAPHY
Diane Edwards
Main Body
7: Environment And Health Outdoor Air Pollution
9: Predictors Of Emergency Department Use At Neighbourhood Level In The West Midlands
1.1 Introduction
This chapter will outline work underway to prepare for reporting cancer statistics for ONS Statistical geographies and will provide an update on minor geographical changes to national Cancer Networks and the rollout of the new Digital Mapping Agreement for the NHS.
1.2 Using Middle Super Output Areas to Report Cancer Statistics
West Midlands Cancer Intelligence Unit (WMCIU) has traditionally reported statistics for small areas at ward level. Ward boundaries are administrative areas defined for the purposes of local government, primarily to elect councillors. The advantage of presenting cancer data at this geography is that their boundaries are generally understood at local level but there are significant disadvantages in using wards to present health statistics:
- Ward boundaries undergo a regular cycle of review by the Boundary Committee for England to ensure the electoral arrangements of all local authorities in England are fair but this means that in any year there could be a new set of ward boundaries in one or more of the 30 local authorities in the region.
- Whilst all the wards in one local authority are of a similar size they may be very different in size to wards in an adjacent local authority e.g. some wards in West Midlands represent less than 800 people, others more than 30,000 people.
- It is impossible to present reliable data on cancer for very small populations because the number of events occurring in such areas will be small and small changes in number from year to year make it very difficult to determine whether a time trend is genuine or merely a chance occurrence. Data for the wards with smaller populations is less robust than the same data for wards with larger populations.
1.3 Super Output Area Statistical Geographies
Following the 2001 census ONS adopted new methods for developing census output area geography by assigning like postcodes and property types to areas of consistent population sizes. The resulting census output areas are then used as building blocks to develop a hierarchy of statistical geographic areas for England and Wales collectively referred to as Super Output Areas (SOAs).
ONS proposed a 3-tier hierarchy of SOAs:
Lower Super Output Areas (LSOAs)
- Groups of 3-5 census output areas.
- An average population size 1,500, minimum 1,000.
- Constrained to fit wholly within the ward boundaries as defined at 31st December 2003.
- 3,482 in the West Midlands, 32,482 in England; each identified by 9 character alphanumeric code.
Middle Super Output Areas (MSOAs)
- Built from groups of 3-5 LSOAs
- Average population size 7,200, minimum 5,000.
- Constrained to local authority boundaries as defined at 31st December 2003.
- 735 in West Midlands; identified by 9 character alphanumeric code and name based on local authority name and 3 digit reference number.
Upper Super Output Areas
- Average population size approx 25,000.
- Expected to number approximately 200 in West Midlands,
- NOT currently defined as no need has been identified.
LSOAs and MSOAs have been adopted by ONS and should remain fixed at least until 2011 Census. ONS will only redefine them at 2011 Census if there has been particular growth or contraction in population since 2001. Any changes will be designed to cause minimum fragmentation of 2001 areas.
1.4 Providing Time Series Population Denominators for MSOAs
To supply cancer statistics the WMCIU needs to have access to detailed time series population denominators for all reporting geographies. Time series population denominator datasets are not routinely produced by ONS or from any other national source. Instead ONS concentrate their efforts on producing annual population estimates for current geographies.
Since 2001 Census ONS have produced mid-year estimates of population for electoral ward geographies as defined at 31st December each year and for the new LSOA and MSOA statistical geographies.
The UK Association for Cancer Registries (UKACR) has undertaken an extensive process of re-attributing historic ward population denominators to current LSOA geographies and now has one consistent time-series population denominator database from 1981–2007 for LSOAs and MSOAs in England and Wales.
1.5 Providing Deprivation Indices for MSOAs
The Indices of Deprivation 2007 (ID2007) published by the Department for Communities and Local Government are based on LSOA geographies. The WMCIU has used the LSOA scores and ranks to develop an average MSOA score in each domain of the ID2007. Each of the 735 MSOAs in the region are then ranked by both average score and rank to determine the population weighted deprivation quintile within the region.
This data is provided on the accompanying CD-ROM and is also downloadable from the Key Health Data website www.bham.ac.uk/keyhealthdata
1.6 Local Names for MSOAs
One disadvantage of using MSOAs to provide cancer statistics was seen as the lack of local names for the areas. ONS recognised this in 2005 and invited local authorities to provide names for them. As local authorities do not produce much statistical information many did not respond to the consultation and as a result ONS was only able to provide local names for MSOAs in Sandwell, Shropshire and Walsall. Consultation with the remaining local authorities in the West Midlands during the course of Spring 2009 has provided names for Coventry, Herefordshire, Solihull, Staffordshire, Stoke on Trent and Warwickshire. The Health GIS team at WMCIU have therefore devised local names for the remaining 10 local authorities. We undertook wherever possible NOT to reuse a ward name unless the boundaries were coterminous with a ward that existed in the 2001 census and to choose geographical names/strings of names from the Ordnance Survey 1:50,000 maps rather than create new ones. Although we have shared our lists with the local authorities concerned and West Midlands Regional Observatory these names should not be regarded as official.
This data is provided on the accompanying CD-ROM and is also downloadable from the Key Health Data website www.bham.ac.uk/keyhealthdata
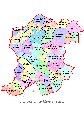
Map 1.1: Sandwell PCT
|
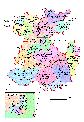
Map 1.2: Shropshire County PCT
|
Map 1.3: Walsall PCT
|

A series of 15 maps showing these local names; MSOA codes and census ward boundaries for every PCT in the region are provided on the accompanying CD-ROM and are downloadable from www.bham.ac.uk/keyhealthdata
1.7 Using MSOAs to report Cancer Statistics
The benefits of using SOA geographies for cancer statistics are that they:
- Are specifically designed for statistical purposes.
- Represent both a stable and coterminous hierarchy of geographies.
- Are supported by annual mid-year estimates of population.
Their main drawbacks are that:
- They do not relate directly to local democratic areas.
- They do not have easily identifiable names.
As LSOA geographies account for an average population of 1500 people (typically less than 50 per five-year age-sex group), it is impossible for WMCIU to publish cancer statistics at this level without compromising UKACR confidentiality guidelines. In an effort to acknowledge the need for small area data (sub-local authority level) and at the same time ensure that the data, and any conclusions drawn from it are robust the WMCIU will adopt the MSOA as the geography of choice for the provision of small area cancer statistics.
The presentation of data at MSOA level will affect different Primary Care Trusts (PCTs) in different ways. In rural areas, MSOAs will sometimes span up to five geographically large but sparsely populated wards and therefore provide less detail in the outputs made available for them. In urban areas there will be more MSOAs than wards and so greater detail will be available in the cancer statistics than was previously possible.
1.8 Cancer Statistics for MSOAs in 2000-2006
A summary table showing cancer incidence for key cancer sites by MSOA in the region is provided on the accompanying CD-ROM and can be downloaded from www.bham.ac.uk/keyhealthdata
1.9 Cancer Network Geography
Cancer Network geography has remained static in 2008 except for the merger of Mid-Trent, Derby-Burton and Leicestershire, Northampton and Rutland cancer networks into one East Midlands Cancer Network from 1st October 2008. This reduces the number of cancer networks in England from 30 to 28 and sees the cancer care of residents of East Staffordshire managed under a wider East Midlands Cancer Network.
A new national boundary set is provided from aggregations of LSOAs.
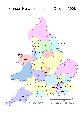
Map 1.4: Cancer Networks in England and Wales
|
Since August 2008 a Cancer Network and a Cancer Registry field have been added to the NHS Postcode Directory.
1.10 Access to Digital Map Data by NHS Organisations
A new framework agreement for the procurement of geographical data by NHS organisations was awarded to Dotted Eyes, Bromsgrove 1st May 2008. All NHS organisations may now purchase licenses through the NHS Digital Mapping Agreement (DMA).
Cancer Registries and Public Health Observatories continue to access geographical data through the Department of Health license to the Pan Government Agreement (PGA) renegotiated from 1st April 2009.
Not all datasets delivered under the PGA are compatible with those in the DMA which might have implications for joint working.