West Midlands Key Health Data 2006/07
CHAPTER THREE: TREND DATA FOR SELECTED PCT PROFILE INDICATORS
Sara Deakin
Main Body
7: Childhood Obesity Monitoring And Prevention Research
8: Treatment For Drug Misuse In The West Midlands 2005/6
9: Smoking And Smoking Cessation: Health Efects And Prevalence Trends
3.1 Introduction
This chapter builds on the work of the previous two years KHD chapters, where trend data were provided for key indicators for all Primary Care Trusts (PCTs) across the region based on the 2002 configuration (WM KHD 2004/5) and all lower tier Local Authorities (LAs) across the region (West Midlands KHD 2005/06). This year a selection of the indicators is presented by the new 2006 reconfigured Primary Care Trusts.
The West Midlands Public Health Observatory is updating the Local Profiles which will provide key indicators of demography, mortality and morbidity to reflect the new configuration. These data can be accessed at http://www.wmpho.org.uk/profiles/?id=pct. It is intended that this section will be added to throughout the year to provide a comprehensive library of indicators at both a PCT and LA geographical level.
In order to highlight health inequalities across the region, this chapter presents trend data for those PCTs with Directly Standardised Rates (DSRs) which fall into approximately the highest and lowest 20 per cent of all West Midlands PCTs in the baseline year of 1995 i.e. the top 3 and bottom 3 PCTs for that indicator in 1995. The CD-ROM enclosed with this publication contains 1995-2005 trend data for all PCTs across the West Midlands Region.
All the charts except for All Causes show directly standardised mortality rates (DSRs) for a specific disease. Deaths were extracted from the ONS annual death extracts from 1995 to 2005 using the year of death registration and standardised to the European Standard Population. PCT codes were allocated using the ‘gridallFeb2007 NHS Organisation Code’ table supplied by the Organisation Codes Service division of the NHS Information Authority. ONS Mid-year estimates were downloaded from ONS current dataset.
http://www.statistics.gov.uk/statbase/Product.asp?vlnk=601&More=N
Unfortunately these were only available from and including 2002. For the years 1995 to 2001 PCT populations were derived from the UKACR (United Kingdom Association of Cancer Registries) Populations for the appropriate year. However, the UKACR Populations do not reflect the ward changes that occurred within Birmingham and this means that the population trends produced from the combination of these two sources for the three Birmingham PCTs is not smooth and any comparison between rates pre- and post 2001 should be interpreted with caution.
From January 2001 following recommendation from the World Health Organisation (WHO) mortality data cause of death has been coded in accordance with the Tenth Revision of the International Classification of Diseases (ICD-10). This means that for trend analysis, the number of deaths coded to the equivalent ICD-9 code is multiplied by the comparability ratio calculated using the ONS methodology. This produces an ‘expected’ number of deaths which would have been coded to that specific cause under ICD-10. Further information on comparability ratios can be found at http://www.statistics.gov.uk/about/classifications/icd10/comparability_ratios.asp
Chart Legend
|
3.2 Mortality from All Causes Aged Under 75
Figure 3.2.1: PCTs with DSRs that fall into the highest 3 of all West Midlands PCTs (1995 baseline)
|
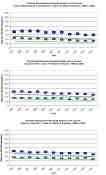
Figure 3.2.2: PCTs with DSRs that fall into the lowest 10 percent of all West Midlands PCTs (1995 baseline)
|

3.3. Mortality from All Causes Aged 75 and over
Figure 3.3.1: PCTs with DSRs that fall into the highest 3 of all West Midlands PCTs (1995 baseline)
|

Figure 3.3.2: PCTs with DSRs that fall into the lowest 3 of all West Midlands PCTs (1995 baseline)
|

3.4. Mortality from Coronary Heart Disease Aged under 75
Figure 3.4.1: PCTs with DSRs that fall into the highest 3 of all West Midlands PCTs (1995 baseline)
|

Figure 3.4.2: PCTs with DSRs that fall into the lowest 3 of all West Midlands PCTs (1995 baseline)
|

3.5. Mortality from Coronary Heart Disease Aged 75 and Over
Figure 3.5.1: PCTs with DSRs that fall into the highest 3 of all West Midlands PCTs (1995 baseline)
|

Figure 3.5.2: PCTs with DSRs that fall into the lowest 3 of all West Midlands PCTs (1995 baseline)
|

3.6 Mortality from Stroke Aged Under 75
Figure 3.6.1: PCTs with DSRs that fall into the highest 3 of all West Midlands PCTs (1995 baseline)
|

Figure 3.6.2: PCTs with DSRs that fall into the lowest 3 of all West Midlands PCTs (1995 baseline)
|

3.7 Mortality from Stroke Aged 75 and Over
Figure 3.7.1: PCTs with DSRs that fall into the highest 3 of all West Midlands PCTs (1995 baseline)
|

Figure 3.7.2: PCTs with DSRs that fall into the lowest 3 of all West Midlands PCTs (1995 baseline)
|

3.8. Mortality from All Circulatory Disease Aged Under 75
Figure 3.8.1: PCTs with DSRs that fall into the highest 3 of all West Midlands PCTs (1995 baseline)
|

Figure 3.8.2: PCTs with DSRs that fall into the lowest 3 of all West Midlands PCTs (1995 baseline)
|

3.9. Mortality from All Circulatory Disease Aged 75 and Over
Figure 3.9.1: PCTs with DSRs that fall into the highest 3 of all West Midlands PCTs (1995 baseline)
|

Figure 3.9.2: PCTs with DSRs that fall into the lowest 3 of all West Midlands PCTs (1995 baseline)
|

3.10. Mortality from All Cancers Aged Under 75
Figure 3.10.1: PCTs with DSRs that fall into the highest 3 of all West Midlands PCTs (1995 baseline)
|

Figure 3.10.2: PCTs with DSRs that fall into the lowest 3 of all West Midlands PCTs (1995 baseline)
|

3.11. Mortality from All Cancers Aged 75 and Over
Figure 3.11.1: PCTs with DSRs that fall into the highest 3 of all West Midlands PCTs (1995 baseline)
|

Figure 3.11.2: PCTs with DSRs that fall into the lowest 3 of all West Midlands PCTs (1995 baseline)
|

3.12. Mortality from Accidents Aged Under 15
Figure 3.12.1: PCTs with DSRs that fall into the highest 3 of all West Midlands PCTs (1995 baseline)
|

Figure 3.12.2: PCTs with DSRs that fall into the lowest 3 of all West Midlands PCTs (1995 baseline)
|

3.13. Mortality from Accidental Falls Aged 75 and Over
Figure 3.13.1: PCTs with DSRs that fall into the highest 3 of all West Midlands PCTs (1995 baseline)
|

Figure 3.13.2: PCTs with DSRs that fall into the lowest 3 of all West Midlands PCTs (1995 baseline)
|

References:
- Office of National Statistics experimental Mid-year Population Estimates 2001 to 200 [Online] http://www.statistics.gov.uk/statbase/Product.asp?vlnk=601&More=N
accessed on 25th May 2007
For more information please contact Sarafina
Cotterill
© Department
of Public Health and Epidemiology, University of Birmingham