West Midlands Key Health Data 2009/10
CHAPTER TWO: DEPRIVATION IN THE WEST MIDLANDS STRATEGIC HEALTH AUTHORITY
Dr Khesh Sidhu: NHS West Midlands
Main Body
7: Changes in Heart Attack Admissions since the Smoking Ban
8: Measuring Disability Across the West Midlands
9: Surveillance of Clostridium Difficile in the West Midlands
2.1 Introduction
This chapter describes the general population of the West Midlands SHA in terms of its population age profile by deprivation indices. The deprivation index used is the Index of Multiple Deprivation (IMD) score. This is derived from a number of variables and is aggregated into national quintiles for ease of use. The poorest quintile of households is in IMD quintile 1 and the most affluent is in quintile 5.
2.2 Method
The approach used by the author is to use the registered populations as found on the West Midlands CBSA website1. This is based on patients registered to GPs in the West Midlands. The patient’s postcode was linked to the IMD quintile score for households in that postcode.
IMD scores were based on 2007 and have been derived by the CIU GIS team2. This file contains known postcodes for the entire region and the relevant imputed IMD quintile. It should be noted that this is the most complete file available at the time of analysis.
2.3 Findings
The numbers of patients registered with West Midlands GPs on the WMCBSA database is 5,676,579 (30th June 2010). Of these, 97% (5,497,471) had postcodes that could be matched with an IMD 2007 score and the age structure by IMD quintile is described in the table below:
Table 2.1: The number of patients registered with West Midlands GPs on the WMCBSA database
|
Source: WMCBSA |
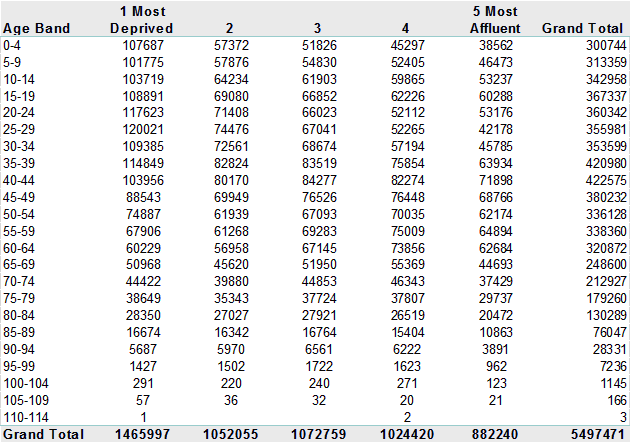
Figure 2.1: Age Structure by numbers for West Midlands Registered patients with IMD Score (June 2010)
|

Figure 2.2: Age Structure by Percentage for West Midlands Registered patients with IMD 2007 Score(June 2010)
|

Figure 2.3: IMD 2007 Quintile Profile for West Midlands Register Patients (June 2010)
|

2.4 Conclusions
The splaying of the quintiles in Figure 2.3 indicates that the demography of the West Midlands is tilted heavily towards the most deprived populations.
However, placing this aside, it can be observed that children and young adults predominate the most deprived populations in the West Midlands. The proportion of poor elderly (i.e. living in the lowest quintile) is also more in the West Midlands than would be expected. These relative patterns of deprivation by age will vary from PCT to PCT.
References:
- http://www.hcs.nhs.uk/ previously WMCBSA
- West Midlands Cancer Intelligence Unit (Diane Edwards)