West Midlands Key Health Data 2009/10
CHAPTER FOUR: RECESSION AND HEALTH
Dr Lucy Doos and George Fowajuh: West Midlands Public Health Observatory
Main Body
7: Changes in Heart Attack Admissions since the Smoking Ban
8: Measuring Disability Across the West Midlands
9: Surveillance of Clostridium Difficile in the West Midlands
4.1 Background
For many years, alcohol-related health problems have been recognized as a major public health problem1. Alcohol consumption is associated with a considerable morbidity and significant health service expenditures2. It is also a major contributor to death and disability among European populations3. According to the World Health Assembly (1983)4, hazards related to alcohol consumption are among the world’s major public health challenges.
The United Kingdom has a serious problem in relation to the increasing levels of the adverse effects of drinking across different genders and age groups5. In 2006, the UK was rated as the third highest across 25 EU member states for the number of drinks consumed in one sitting. In addition, the UK has one of the highest rates of admission to hospital or an emergency department due to alcohol use in 15-16 year olds across the EU countries6.
Alcohol-related illness or injury accounts for nearly a million hospital admissions per year and they are increasing. The annual healthcare costs related to alcohol misuse add up to £1.7 billion per year and the bulk of these costs are borne by the NHS7.
According to the former government national indicators, alcohol related hospital admissions; National Indicator 39 (NI39) measures the rate of alcohol related admissions per 100,000 population using Hospital Episode Statistics7.The rate is calculated using data on those finished in-year admissions that are classified as ordinary or day cases and that have a primary or subsidiary diagnosis7. The alcohol related admissions were calculated using the alcohol-attributable fractions calculated by the North West Public Health Observatory (NWPHO) 8.
Each admission is assigned an attributable fraction based on the diagnosis codes and age and sex of the patient. The attributable fraction represents the proportion of admissions that can be attributed to alcohol and were based on a review of the available research. Where an admission has more than one relevant diagnosis code, the highest attributable fraction is used. Only those alcohol related diagnoses with a sufficiently high attributable fraction (an all-age fraction greater than 0.2 for either males or females) are used in order to reduce the ‘noise’ created by confounding factors7. Generally, alcohol indicators are either entirely related to alcohol (alcohol-specific) or are influenced only in part by alcohol (alcohol-attributable) 6.
The West Midlands Public Health Observatory (WMPHO) provides annual and quarterly data on the trends in alcohol related admissions for every PCT. These data indicate existing trends in alcohol related ill-health for every PCT and provide a baseline against which PCTs can measure delivery of the indicator.
This chapter demonstrates the trends in alcohol related admissions in the West Midlands region, percentage of annual change in the NI39 over last year by PCT, and trends in NI39 by age group. It will also illustrate the most common alcohol specific and alcohol attributable admissions. In addition, the chapter will look at the number of actual admissions and the number of individuals who contribute to the NI39 indicator as any intervention must be targeted at individuals or defined segment of the population.
The chapter also provides update of latest alcohol-related mortality for the West Midlands Region.
We will be using admission data for 2008/2009 as a cut-off point as this was the latest whole year data available for analysis.
4.2 Alcohol-related Hospital Admissions
4.2.1 Alcohol related Hospital Admissions in the West Midlands compared to other English regions
In 2008/09, there were 945,223 alcohol-related admissions in hospitals of the nine English regions and 11.1% of these admissions were in the West Midlands region. Compared to other English regions, the West Midlands region had the third highest directly standardised rates (DSR) for alcohol-related hospital admissions in 2008/2009 (Figure 4.1).
Despite the steady increase in the DSR for alcohol related admissions in the West Midlands between 2002/2003 and 2008/2009, the rates stayed below the England rate and up until 2006/2007 when the West Midlands rates exceeded the England one and continued to increase in 2008/2009 (Figure 4.2).
Figure 4.1: Directly Standardised Rates (DSR) of alcohol-related admissions per 100,000 populations by health region 2008/2009
|

Figure 4.2: Trends in DSR alcohol related admissions between 2002/2003 and 2008/2009
|

4.2.2 Alcohol related admissions in the West Midlands by PCTs
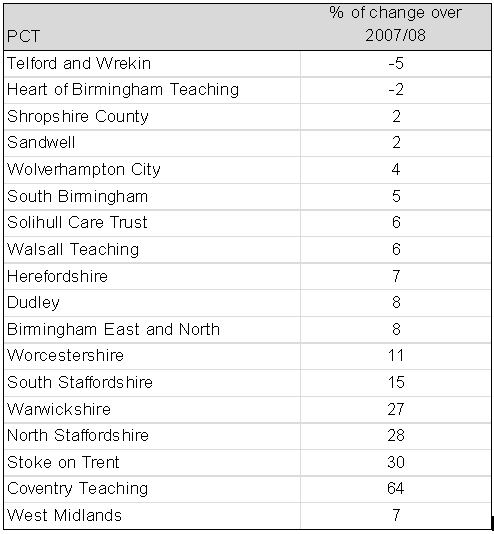
The DSR of alcohol related admissions for 2008/09 varies between different Primary Care Trusts (PCTs) within the West Midlands region, with Heart of Birmingham PCT had the highest rate of admissions
(2571 per 100,000 population) and Warwickshire PCT had the lowest rate (1153 per 100,000 population) (Figure 4.3).
However, among different PCTs in the West Midlands region, Heart of Birmingham PCT showed the second highest percentage of reduction in alcohol related admissions over the previous year (2%) after Telford and Wrekin PCT (5%) (Table 4.1)
Figure 4.3: DSR Alcohol related admissions in the West Midlands by PCT for 2008/09
|

Table 4.1: Percentage of change in alcohol related admissions in the West Midlands over 2007/2008 by PCT
 |
4.2.3 Common disorders of alcohol related admissions
Admissions for alcohol have been grouped into alcohol-attributable admissions and alcohol-specific admissions. Tables 4.2 and 4.3 present the five common alcohol attributable and specific admissions in the West Midlands in 2008/2009. More than three quarters of all alcohol related admissions are mainly due to alcohol attributable conditions.
Over half (54%) of the alcohol related diagnoses (whether primary or secondary) fall into the category of “diseases of the circulatory system”. This includes hypertensive diseases and cardiac arrhythmias. On the other hand, mental and behavioural disorders due to alcohol are the next biggest category, with 15% of all admissions.
Table 4.2: Five common alcohol attributable admissions in the West Midlands region in 2008/09
|
Table 4.3: Five common alcohol specific admissions in the West Midlands region in 2008/09
|
4.2.4 Age and Gender
Overall 62% of those alcohol related admissions occurring in 2008/2009 in the West Midlands were males. Between 2006/2007 and 2008/2009, the number of alcohol related admission has steadily increased among both males and females. The percentage of increase in the number of admissions between 2007/2008 and 2008/2009 is higher among males (12.5%) than among females (11.6%). However the opposite was observed between 2006/2007 and 2007/2008 (2.0% and 4.6% among males and females respectively).
Figure 4.4 shows that alcohol related admissions in 2008/2009 gradually increased with the advance of age, with 63% of admissions are among those aged 55 years and above, while those under 25 years represented only 5.2% of the total admissions.
The numbers of admissions among those aged 25 years and above kept fluctuating between Quarter 1 (Q1) 2006/2007 and Q4 2008/2009 and it showed a continuous increase in the three 2009/2010 quarters (latest available quarter data). On the other hand, the numbers for those aged less the 25 years stayed nearly unchanged or slightly decreased (Figure 4.5).
Figure 4.4: Alcohol related hospital admissions in the West Midlands in 2008/2009 by age groups
|

Figure 4.5: Trend in alcohol related admissions In the West Midlands between Q1 2006/07 and Q3 2009/2010 by age groups
|

While the percentage of change in the number of admissions over the previous year (2007/2008) showed a slight decrease among those aged less than 25 years (3%), this percentage had increased to 13% among those aged 25 years and above (Table 4.4).
Table 4.4: Percentage of change in the number of alcohol admission in the West Midlands over the previous years by age groups
|
Among those aged less than 25 years, the percentage of males and females admissions was very close throughout the period between 2006/2007 and 2008/2009. On the other hand, among those aged 25 years and above, males represented nearly two thirds of the total admissions during the same period (Table 4.5).
Table 4.5: Percentage of alcohol related admissions in the West Midlands between 2006/2007 and 2008/2009 by gender and age group
Source: HES 2008-2009, WMPHO analysis9 |
4.2.5 Length of stay
The mean length of stay (LOS) for alcohol related admissions gradually decreased from 4.4 days in 2006/2007 to 4.1 days (Table 4.6) and in 2008/2009 both men and women stayed for the same mean LOS (4.1 days). In addition, there were no statistically significant differences between the mean LOS for alcohol attributable-admissions (4.0 days) and alcohol specific admissions (4.3 days) in 2008/2009.
Table 4.6: Change in the mean LOS for alcohol related admissions in the West Midlands between 2006/2007 and 2008/2009
|
Moreover, nearly 40% of the admissions in the West Midlands in 2008/2009 were discharged on the same day of admission and 20.7% stayed in hospitals for only one day (Figure 4.6). On the other hand, only 8.2% of admissions stayed in hospital for more than 10 days.
Figure 4.6: LOS in days for alcohol related admissions in the West Midlands in 2008/2009
|

Figure 4.7 shows that the mean LOS for alcohol related admissions in 2008/09 in the West Midlands has gradually increased with the advance of age, with the exception of those aged between 25 and 34 years.
Figure 4.7: Mean LOS for alcohol related hospital admissions in the West Midlands in 2008/09 by age groups
|

As can be seen in Figure 4.8, the mean LOS for alcohol related admissions in 2008/09 in the West Midlands region varied considerably between different PCTs in the region, with North Staffordshire PCT had the longest mean LOS (5.5 days), while Coventry Teaching PCT had the shortest mean LOS (3.1 days).
Figure 4.8: Mean LOS for alcohol related admissions in the West Midlands in 2008/09 by PCTs
|

As can be seen in Figure 4.8, the mean LOS for alcohol related admissions in 2008/09 in the West Midlands region varied considerably between different PCTs in the region, with North Staffordshire PCT had the longest mean LOS (5.5 days), while Coventry Teaching PCT had the shortest mean LOS (3.1 days).
4.3 Alcohol-related admissions and persons
It is important to note that the number of actual admissions and the number of alcohol-related admissions will be different because of the applications of attributable fractions to real admissions. Also, the number of alcohol-related admissions and the number of persons that contribute to the alcohol admissions is likely to be different because a person may have multiple admissions within the data year. For example if a 45 year old male is admitted once for alcoholic gastritis and six times for fire injuries, he will contribute once to the total admissions of individuals in that year, 7 to the total admissions and 3.28 to the alcohol admissions in that year (attributable fraction for alcoholic gastritis is 1 and for fire injury is 0.36 thus alcohol admission in this case will be 1+ (0.36*6) =3.28)
In order to implement interventions that address alcohol harm, it is important to understand not only the number of alcohol admissions discussed in section 1.2 but also the number of individuals that contribute to the admissions. This section looks at the number of individuals admitted for alcoholic conditions and also individuals with multiple admissions. It is useful to identify patients or categories of patients who required multiple repeated inpatients treatment in order to identify appropriate course of treatment and service for this group of patient.
4.3.1 Individual by sex and age
Analysis of 2008/2009 HES data by the West Midlands Public Health Observatory showed that 259,719 individuals contributed to 102,773 alcohol admissions in the West Midlands region with some patients having more than one admission in 2008/2009. Figure 4.9 shows the relative contribution of selected age bands and sex to the overall number of individuals (note not number of NI39 admissions) with alcohol related admissions in 2008-2009. Of all the persons admitted for alcohol harm in 2008-2009, 52% were females. Generally slightly more males than females contribute to alcohol admissions until after the age of 74 when the number of females is more than that of males. The figure shows that those in the older age group contributed more to alcohol admissions than the younger age group. About 60% of all alcohol related admissions were in those aged 65 years old and over.
Figure 4.9: Relative contribution of selected age bands and sex to the overall number of persons with alcohol related admissions in 2008-2009
|

4.3.2 Multiple alcohol related admissions in the West Midlands
It is possible that a small number of patients could be making significant contributions to the total number of alcohol-related admissions by having repeated inpatient episodes of care than others. The need to identify these patients, their conditions and other characteristics is important to guide interventions needed to reduce the level of hospital alcohol-related admissions.
Table 4.7a and 4.7b shows the number of alcohol related admissions, the number of patients and the number of patients who were readmitted for the same conditions in 2008-2009. If, for example a patient was admitted for ethanol poisoning and then later admitted for alcohol liver diseases and ethanol poisoning at subsequent dates, the second admission for ethanol poisoning would be counted as a readmission while the admission for alcohol liver diseases would not be considered a readmission for this analysis. However all three admissions will be included in the total for alcohol-related admissions.
Multiple alcohol related admissions analysis shows that 17% of patients admitted for an alcohol-specific condition were readmitted for the same condition in 2008-2009. For alcohol-specific conditions, alcoholic liver disease had the highest percentage of readmitted patients (29%). For alcohol-attributable admission, 22% of patients admitted for an alcohol-related condition were readmitted for the same condition in 2008-2009. The highest percentage of readmitted patients for alcohol attributable condition was for malignant neoplasm of breast (50%) followed jointly by Cardiac arrhythmias (26%) and Epilepsy and Status epilepticus (26%). For alcohol-attributable admission, we cannot say exactly if the multiple admissions were alcohol induced as only a proportion of the admission (8% in the case of malignant neoplasm of breast) would be due to alcohol.
Table 4.7a: Number of alcohol-specific admission, patients and readmissions in the West Midlands 2008-2009
Source: HES 2008-2009, WMPHO analysis9 |
Table 4.7b: Number of alcohol-attributable admission, patients and readmissions in the West Midlands 2008-2009
Source: HES 2008-2009, WMPHO analysis9 |
4.4 Alcohol related deaths in the West Midlands
Increased alcohol consumption is associated not only with alcohol morbidity but also with an increase in mortality. This section provides an update of latest alcohol related mortality for the West Midlands Region. The data on alcohol mortality refers to both alcohol specific and alcohol related deaths pooled for 3 years (2006 to 2008) because of small numbers.
Figure 4.10 shows alcohol-related mortality in the West Midlands by primary care trusts (PCTs). Due to the small number of deaths at PCT level a three year average has been calculated. The analysis shows that death rate in males from alcohol-related conditions in the West Midlandsregion is about twice that in female. Within the region, there is marked variation in alcohol-related mortality rate in males between the PCTs. The highest male alcohol-related mortality rate occurs in Wolverhampton and is over 2 times higher than the lowest found in Solihull. On the other hand there is less variation in female alcohol-related mortality within the region with the highest rate occurring in Wolverhampton and the lowest rate in Solihull.
Figure 4.10: Directly Standardised mortality rates (DSR) per 100,000 for alcohol related mortality by gender and the West Midlands PCTs, all ages, 2000-2004
|

4.5 Key Findings
- Alcohol related admissions give a measure of the amount of harm to physical and mental health that alcohol misuse is causing on both national and regional level.
- Alcohol related admissions represent a growing problem in the West Midlands region and levels of alcohol related admissions have increased steadily over the past few years.
- Despite the increase in the number of alcohol-related admissions over the past few years, there is a steady decline in the mean length of stay and this may reflects the NHS policy towards reducing the mean LOS for most of admissions.
- There are very evident variations in the alcohol related admissions between different PCTs, age Groups and genders in the West Midlands region.
- Although more people in the older age group (aged 74 and over) are admitted for an alcohol-related condition, the major age group contributing to most of the alcohol-related admissions are in those aged 55 to 74 years old.
- About a fifth of those admitted for alcohol-related conditions were readmitted for the same condition.
- Alcohol-related deaths rates are about twice that of females in the West Midlands region.
- There is a marked variation in alcohol-related deaths rates in males in the PCTs in the West Midlands region. This variation is not present in death rates in females.
4.6 Recommendations
Increasing levels of alcohol related hospital admissions across the West Midlands region need to be addressed. Reasons for increasing both alcohol attributable and specific admissions need to be tackled in order to reduce the burden on public services.
The use of social marketing tool will be useful to provide more insight and disentangle the disproportionate admission and readmission rates in the West Midlands region.
References
- Iain K. Crombie, Linda Irvine, Lawrence Elliott and Hilary Wallace (2007) How do public health polices tackle alcohol-related harm? A Review of 12 developed countries. Alcohol & Alcoholism 42 (5):492–499.
- Catherine Meads, Sharlene Ting, Janine Dretzke& Sue Bayliss(2007): A systematic review of the clinical and cost-effectiveness of psychological therapy involving family and friends in alcohol misuse or dependence DPHE 2007, Report Number 65
- World Health Organisation (WHO) (2005): Alcohol policy in the WHO European Region: current status and the way forward
- The World Health Assembly (1983): Twelfth plenary meeting, 13 May 1983 - Committee A, first report
- Plant M. (2004): The alcohol harm reduction strategy for England. BMJ. 328(7445):905-6, (Apr 17) [Editorial]
- Alcohol: Indications of Public Health in the English regions, Alcohol Executive summary (2007)
- Community and local government National Indicators for Local Authorities and Local Authority Partnerships: Handbook of Definitions (2007) http://www.communities.gov.uk/documents/localgovernment/pdf/735115.pdfLast accessed in April 2010
- North West Public Health Observatory (NWPHO): www.nwpho.org.uk/LapeLast accessed in June 2010
- Hospital Episode Statistics (HES) 2008-2009, WMPHO analysis
- Office of National Statistics (ONS) mortality data and mid-year population estimates (2008), WMPHO analysis
For more information please contact Sarafina
Cotterill
© Public Health, Epidemiology and Biostatistics Unit, School of Health and Population Sciences, University of Birmingham