|
Main Body
7: Changes in Heart Attack Admissions since the Smoking Ban
8: Measuring Disability Across the West Midlands
9: Surveillance of Clostridium Difficile in the West Midlands
|
11.1 Introduction
This chapter details the prevalence of vascular-related conditions in Heart of Birmingham Teaching Primary Care Trust (HoBtPCT) in the population aged 40 years and over. It is well known that the prevalence of vascular-related conditions is dependent on gender, age and ethnicity. Methods of assessing prevalence by gender and age group are well established. However, methods for establishing prevalence incorporating ethnicity (cultural origin) are not generally available.
HoBtPCT has a registered population of 320,805 (April, 2010). The majority (64%) of the resident population is from what are usually considered minority ethnic groups while 36% of residents are white. (ONS, 2007). It has a young population with only 33% aged 40 years and over.
For more than 5 years, HoBtPCT has invested considerable effort and resources in primary health care services specifically to promote the identification of vascular-related conditions (listed in Table 11.1). Data from nearly 100,000 identifiable clinical records of patients aged 40y+ registered with 70 of the 74 general practices is stored on a secure central database managed by one of the authors (FB).
The purpose of the database is to improve care and facilitate clinical quality assurance, e.g. it is used to generate automated, sophisticated patient reports of a standard that would be written by a hospital consultant designed to enhance clinical management.
11.2 Method
A more detailed technical methodology is available at the end of the chapter (Appendix A)
The technique developed to incorporate cultural origin is feasible since:
| |
a |
HoBtPCT is a large PCT with ~ 300,000 registered population |
b |
A high proportion of general practices (95%) cooperate and support enhanced vascular disease control activities |
c |
Seventy-seven percent (77%) of the population has a medical record containing the patients’ “self-reported cultural identification”. |
d |
The bulk of HoBtPCT population comprises just a few cultural groups: indigenous UK (white/British), Bangladeshi, Pakistani, Indian and Black. As a result, nearly 50% of patients with no record of “self-reported cultural identification” (ethnicity) can be appropriately assigned using a ‘”common names” algorithm by Mosaic Origins software program 1 |
|
|
For the purpose of this work, the term ethnicity includes cultural origin and ‘self-reported cultural identification’.
Data from all 98,982 patients aged 40+ years has been used. Of these, 43,000 were identified as having one or more of the seven vascular-related conditions. Table 11.1 shows the number of patients identified (total population and 40y+) as well as the conditions’ prevalence in the 40y+ population.
Table 11.1: Vascular-related conditions in Heart of Birmingham Teaching Primary Care Trust*
| |
|
Condition |
QOF Indicators |
Number on disease register (all ages) |
Number on disease register
(aged 40y+) |
Prevalence (aged 40y+) |
1. |
Coronary Heart Disease |
CHD1 |
7,822 |
7,677 |
7.8% |
2. |
Heart Failure |
HF 1 |
1,542 |
1,486 |
1.5% |
3. |
Diabetes |
DM19 |
18,282 |
16,754 |
16.9% |
4. |
Chronic Kidney Disease |
CKD1 |
7,172 |
7,045 |
7.1% |
5. |
Atrial Fibrillation |
AF1 |
1,723 |
1,690 |
1.7% |
6. |
Hypertension |
BP1 |
34,217 |
32,393 |
32.7% |
7. |
Stroke |
Stroke 1 |
2,995 |
2,887 |
2.9% |
|
|
* Total 40y+ population of 98,982 from 70 of 74 practices.
Unfortunately, 23% of “self reported cultural identification” ‘Ethnicity, Ethnic code data’ extracted from Read Code fields (9i or 9S) were missing. Mosaic Origins software was used to help mitigate this deficiency. Mosaic Origins software is a database which uses over 400,000 first names and one million surnames to identify the origin of an individual’s name, which has been used in social marketing by the NHS 1. It can allocate likely country of origin based on first name and surname. By using this software, 47% of the 23% culturally non-identified patients were assigned to a major cultural group (ethnicity). Even so, the ethnicity of about 12% of all patients remained as “unknown”.
Further analysis was carried out to impute the ethnic categories of the outstanding “unknowns”; the methodology for this is described in Appendix A.
11.3 Findings
For each of the seven identified vascular-related conditions, prevalence is reported by five-year age bands, gender and ethnicity. Results are presented as graphs in the following order:
| |
a. |
Separate male / female based on the 76,231 (76k) patients with self-assigned ethnicity. |
b. |
Separate male / female based on all 98,982 patients comprising:
- the 76,231 (76k) patients with self assigned ethnicity information
- Origins assignment of 10,741 (11k) of the unassigned patients
- 12,010 (12k) residual unknowns.
|
c. |
Separate male / female based on all 98,982 patients comprising:
- the 76k patients with self assigned ethnicity information
- Origins assignment of 10,741 (11k) of the unassigned patients
- imputed ethnicity for the 12,010 (12k) residual unknowns.
|
|
|
In addition, tables of confidence intervals are presented for the prevalence figures based on all patients where ethnicity is fully assigned. Details of the methodology used to calculate the confidence intervals are given in Appendix A
11.4 Ongoing work
By applying these age, gender and ethnic prevalence rates to the population profile of each general practice, it should be possible to calculate the expected number (count) of registered patients with each vascular-related condition at each practice, e.g. expected number of QOF registered diabetic patients for each practice.
A subsequent report will explore the extent of systematic under-reporting by practices and whether such under-reporting appreciably lowers the estimate of the population prevalence. This is part of ongoing work in the HoBtPCT.
11.5 Coronary Heart Disease
Figure 11.1a: Coronary Heart Disease prevalence for males and females by age and ethnicity (self-assigned).
Figure 11.1b: Coronary Heart Disease prevalence for males and females by age and ethnicity (self assigned and Origins-assigned)
Figure 11.1c: Coronary Heart Disease prevalence for all males and females by age and ethnicity (self-assigned, Origins-assigned and unknown imputed)
Table 11.2: Confidence limits for Coronary Heart Disease prevalence for all males and females by age and ethnicity (self-assigned, Origins-assigned and unknown imputed)
| |
Gender |
Agegroup |
Bangladeshi |
Indian |
Pakistani |
Black |
Other |
White/British |
All ethnic groups |
LCL |
UCL |
LCL |
UCL |
LCL |
UCL |
LCL |
UCL |
LCL |
UCL |
LCL |
UCL |
LCL |
UCL |
Male |
40-49 |
2.4% |
5.0% |
1.2% |
2.1% |
2.2% |
3.1% |
0.7% |
1.2% |
0.8% |
1.8% |
1.3% |
2.0% |
1.6% |
1.9% |
|
50-59 |
9.1% |
15.6% |
5.9% |
7.7% |
9.5% |
11.6% |
2.2% |
3.6% |
4.3% |
7.3% |
4.4% |
5.7% |
6.2% |
7.0% |
|
60-69 |
23.0% |
37.8% |
15.8% |
19.7% |
17.6% |
22.1% |
4.2% |
6.9% |
9.8% |
16.3% |
10.4% |
12.5% |
12.7% |
14.2% |
|
70-79 |
30.2% |
42.1% |
26.3% |
32.4% |
28.5% |
33.5% |
9.1% |
12.5% |
18.5% |
27.4% |
18.4% |
21.6% |
21.4% |
23.4% |
|
80+ |
26.9% |
51.8% |
23.4% |
33.0% |
29.0% |
37.5% |
12.6% |
19.0% |
14.7% |
28.7% |
21.7% |
26.8% |
23.1% |
26.5% |
All males |
12.5% |
15.9% |
8.9% |
10.1% |
10.9% |
12.1% |
3.6% |
4.4% |
5.6% |
7.2% |
8.0% |
8.8% |
8.3% |
8.7% |
Female |
40-49 |
0.5% |
2.5% |
0.4% |
1.0% |
0.9% |
1.6% |
0.6% |
1.1% |
0.5% |
1.6% |
0.7% |
1.3% |
0.8% |
1.1% |
|
50-59 |
3.6% |
7.4% |
2.5% |
3.9% |
4.6% |
6.2% |
1.6% |
3.0% |
2.7% |
5.5% |
2.0% |
3.0% |
3.1% |
3.8% |
|
60-69 |
6.5% |
12.9% |
7.3% |
10.2% |
9.3% |
12.4% |
4.8% |
7.7% |
5.7% |
11.1% |
6.4% |
8.3% |
7.6% |
8.8% |
|
70-79 |
8.0% |
16.7% |
14.8% |
19.5% |
13.9% |
17.9% |
8.5% |
11.8% |
7.3% |
14.3% |
12.3% |
15.0% |
12.8% |
14.5% |
|
80+ |
6.0% |
31.7% |
15.1% |
22.4% |
12.8% |
19.6% |
10.6% |
16.1% |
7.3% |
18.2% |
16.7% |
20.3% |
15.7% |
18.2% |
All females |
4.6% |
6.8% |
5.3% |
6.3% |
6.0% |
7.0% |
3.5% |
4.3% |
3.4% |
4.9% |
6.4% |
7.2% |
5.6% |
6.0% |
Persons |
8.8% |
10.9% |
7.3% |
8.1% |
8.7% |
9.5% |
3.7% |
4.3% |
4.8% |
5.9% |
7.3% |
7.9% |
7.1% |
7.4% |
|
|
11.6 Heart Failure
Figure 11.2a: Heart Failure prevalence for males and females by age and ethnicity (self-assigned)
Figure 11.2b: Heart Failure prevalence for males and females by age and ethnicity (self-assigned and Origins-assigned)
Figure 11.2c: Heart Failure prevalence for all males and females by age and ethnicity (self-assigned, Origins-assigned and unknown imputed)
Table 11.3: Confidence limits for Heart Failure prevalence for all males and females by age and ethnicity (self-assigned, Origins-assigned and unknown imputed)
| |
Gender |
Age
group |
Bangladeshi |
Indian |
Pakistani |
Black |
Other |
White/British |
All ethnic groups |
LCL |
UCL |
LCL |
UCL |
LCL |
UCL |
LCL |
UCL |
LCL |
UCL |
LCL |
UCL |
LCL |
UCL |
Male |
40-49 |
0.1% |
1.0% |
0.0% |
0.3% |
0.1% |
0.3% |
0.3% |
0.7% |
0.0% |
0.3% |
0.1% |
0.3% |
0.1% |
0.3% |
|
50-59 |
0.6% |
3.1% |
0.6% |
1.3% |
0.4% |
1.0% |
0.3% |
0.9% |
0.1% |
0.8% |
0.3% |
0.7% |
0.5% |
0.8% |
|
60-69 |
2.4% |
9.7% |
1.9% |
3.5% |
1.2% |
2.7% |
0.7% |
2.0% |
1.6% |
4.9% |
1.6% |
2.5% |
1.8% |
2.4% |
|
70-79 |
7.0% |
14.5% |
3.6% |
6.5% |
3.7% |
6.0% |
3.1% |
5.3% |
2.7% |
7.2% |
4.5% |
6.4% |
4.5% |
5.6% |
|
80+ |
4.0% |
19.7% |
8.3% |
15.1% |
4.8% |
9.3% |
6.0% |
10.9% |
3.1% |
11.7% |
8.5% |
12.1% |
8.0% |
10.2% |
All males |
2.1% |
3.7% |
1.4% |
1.9% |
1.1% |
1.5% |
1.2% |
1.7% |
0.8% |
1.4% |
1.8% |
2.2% |
1.5% |
1.7% |
Female |
40-49 |
0.0% |
0.7% |
0.0% |
0.1% |
0.0% |
0.2% |
0.0% |
0.2% |
0.0% |
0.5% |
0.0% |
0.2% |
0.0% |
0.1% |
|
50-59 |
0.1% |
1.4% |
0.5% |
1.1% |
0.1% |
0.5% |
0.4% |
1.1% |
0.0% |
0.8% |
0.2% |
0.5% |
0.3% |
0.6% |
|
60-69 |
1.1% |
4.5% |
1.3% |
2.7% |
1.4% |
2.8% |
0.7% |
2.1% |
0.3% |
2.3% |
0.8% |
1.5% |
1.2% |
1.7% |
|
70-79 |
0.7% |
4.8% |
2.6% |
4.9% |
2.2% |
4.0% |
2.2% |
4.1% |
1.2% |
5.0% |
2.4% |
3.8% |
2.7% |
3.5% |
|
80+ |
0.7% |
17.8% |
6.7% |
12.1% |
7.8% |
13.4% |
5.0% |
9.1% |
4.2% |
13.2% |
5.8% |
8.1% |
6.7% |
8.5% |
All females |
0.5% |
1.5% |
1.2% |
1.8% |
1.0% |
1.5% |
1.0% |
1.5% |
0.6% |
1.2% |
1.5% |
1.9% |
1.3% |
1.5% |
Persons |
1.4% |
2.3% |
1.4% |
1.7% |
1.1% |
1.4% |
1.2% |
1.5% |
0.7% |
1.2% |
1.7% |
2.0% |
1.4% |
1.6% |
|
|
11.7 Diabetes
Figure 11.3a: Diabetes prevalence for males and females by age and ethnicity (self-assigned)
Figure 11.3b: Diabetes prevalence for males and females by age and ethnicity (self-assigned and Origins-assigned)
Figure 11.3c: Diabetes prevalence for all males and females by age and ethnicity (self-assigned, Origins-assigned and unknown imputed)
Table 11.4: Confidence limits for diabetes prevalence for all males and females by age and ethnicity (self-assigned, Origins-assigned and unknown imputed)
| |
Gender |
Age
group |
Bangladeshi |
Indian |
Pakistani |
Black |
Other |
White/British |
All ethnic groups |
LCL |
UCL |
LCL |
UCL |
LCL |
UCL |
LCL |
UCL |
LCL |
UCL |
LCL |
UCL |
LCL |
UCL |
Male |
40-49 |
13.2% |
18.3% |
9.0% |
11.0% |
9.5% |
11.2% |
4.9% |
6.3% |
5.3% |
7.6% |
3.1% |
4.0% |
6.9% |
7.6% |
|
50-59 |
32.3% |
42.0% |
21.2% |
24.2% |
23.5% |
26.4% |
9.0% |
11.6% |
14.0% |
18.6% |
6.8% |
8.4% |
16.0% |
17.3% |
|
60-69 |
43.1% |
59.2% |
31.8% |
36.6% |
32.0% |
37.4% |
18.0% |
22.8% |
20.8% |
29.2% |
12.5% |
14.7% |
21.8% |
23.6% |
|
70-79 |
45.3% |
57.7% |
38.0% |
44.6% |
37.9% |
43.2% |
34.5% |
39.8% |
30.5% |
40.6% |
17.9% |
21.1% |
31.3% |
33.6% |
|
80+ |
33.4% |
58.9% |
25.7% |
35.5% |
36.9% |
45.8% |
33.2% |
41.7% |
29.6% |
46.2% |
15.6% |
20.2% |
27.4% |
30.9% |
All males |
28.4% |
32.9% |
21.0% |
22.7% |
21.4% |
23.0% |
13.7% |
15.1% |
13.7% |
16.0% |
9.3% |
10.2% |
16.0% |
16.7% |
Female |
40-49 |
17.3% |
24.0% |
7.6% |
9.7% |
11.5% |
13.6% |
5.0% |
6.4% |
4.1% |
6.5% |
2.7% |
3.7% |
7.1% |
7.9% |
|
50-59 |
38.4% |
46.9% |
18.3% |
21.4% |
26.9% |
30.2% |
12.6% |
15.8% |
11.1% |
16.0% |
6.6% |
8.4% |
17.3% |
18.7% |
|
60-69 |
39.4% |
50.3% |
29.4% |
34.2% |
38.4% |
43.3% |
23.3% |
28.6% |
19.2% |
27.4% |
10.7% |
13.0% |
24.1% |
26.0% |
|
70-79 |
36.0% |
49.3% |
33.9% |
39.8% |
40.2% |
45.6% |
35.2% |
40.4% |
26.9% |
37.5% |
15.2% |
18.1% |
29.3% |
31.5% |
|
80+ |
23.7% |
57.4% |
26.3% |
34.9% |
29.4% |
38.1% |
35.6% |
43.6% |
15.7% |
29.4% |
13.7% |
17.0% |
22.6% |
25.5% |
All females |
33.2% |
37.8% |
19.9% |
21.7% |
25.6% |
27.3% |
16.1% |
17.7% |
12.0% |
14.5% |
9.1% |
10.0% |
17.2% |
17.9% |
Persons |
31.4% |
34.7% |
20.7% |
21.9% |
23.6% |
24.8% |
15.1% |
16.2% |
13.3% |
15.0% |
9.3% |
10.0% |
16.7% |
17.2% |
|
|
11.8 Chronic Kidney Disease
Figure 11.4a: Chronic Kidney Disease prevalence for males and females by age and ethnicity (self-assigned)
Figure 11.4b: Chronic Kidney Disease prevalence for males and females by age and ethnicity (self-assigned and Origins-assigned)
Figure 11.4c: Chronic Kidney Disease prevalence for all males and females by age and ethnicity (self-assigned, Origins-assigned and unknown imputed)
Table 11.4: Confidence limits for diabetes prevalence for all males and females by age and ethnicity (self-assigned, Origins-assigned and unknown imputed)
| |
Gender |
Age
group |
Bangladeshi |
Indian |
Pakistani |
Black |
Other |
White/British |
All ethnic groups |
LCL |
UCL |
LCL |
UCL |
LCL |
UCL |
LCL |
UCL |
LCL |
UCL |
LCL |
UCL |
LCL |
UCL |
Male |
40-49 |
0.6% |
2.2% |
0.4% |
0.9% |
0.9% |
1.5% |
0.7% |
1.2% |
0.4% |
1.2% |
0.3% |
0.6% |
0.7% |
0.9% |
|
50-59 |
2.8% |
7.1% |
2.5% |
3.7% |
2.8% |
4.0% |
2.4% |
3.9% |
1.5% |
3.4% |
1.2% |
2.0% |
2.4% |
2.9% |
|
60-69 |
10.9% |
22.8% |
6.0% |
8.6% |
9.3% |
12.8% |
6.1% |
9.3% |
6.1% |
11.5% |
5.1% |
6.6% |
6.8% |
8.0% |
|
70-79 |
28.5% |
40.2% |
19.5% |
25.1% |
18.1% |
22.4% |
17.1% |
21.5% |
18.8% |
27.8% |
16.8% |
20.0% |
19.3% |
21.3% |
|
80+ |
25.4% |
50.1% |
22.7% |
32.3% |
29.0% |
37.5% |
26.9% |
35.1% |
17.1% |
31.8% |
30.8% |
36.4% |
29.9% |
33.5% |
All males |
8.3% |
11.2% |
5.0% |
6.0% |
6.0% |
6.9% |
5.8% |
6.8% |
4.2% |
5.6% |
6.0% |
6.7% |
6.0% |
6.4% |
Female |
40-49 |
0.6% |
2.6% |
0.6% |
1.3% |
0.6% |
1.2% |
0.6% |
1.2% |
0.4% |
1.3% |
0.6% |
1.2% |
0.7% |
1.0% |
|
50-59 |
5.1% |
9.6% |
2.7% |
4.1% |
3.7% |
5.2% |
2.5% |
4.1% |
2.1% |
4.7% |
2.5% |
3.7% |
3.3% |
4.0% |
|
60-69 |
11.6% |
19.4% |
9.6% |
12.8% |
10.1% |
13.3% |
8.1% |
11.7% |
5.1% |
10.2% |
8.1% |
10.2% |
9.5% |
10.9% |
|
70-79 |
14.9% |
25.6% |
18.5% |
23.5% |
16.6% |
20.8% |
17.5% |
21.8% |
18.4% |
28.0% |
19.5% |
22.7% |
19.3% |
21.3% |
|
80+ |
8.8% |
36.8% |
27.0% |
35.7% |
22.2% |
30.2% |
28.4% |
36.0% |
19.2% |
33.7% |
30.4% |
34.6% |
29.5% |
32.6% |
All females |
7.2% |
10.0% |
7.0% |
8.1% |
6.5% |
7.5% |
6.7% |
7.8% |
4.8% |
6.5% |
9.7% |
10.6% |
7.9% |
8.4% |
Persons |
8.1% |
10.1% |
6.1% |
6.8% |
6.4% |
7.0% |
6.4% |
7.1% |
4.7% |
5.8% |
7.8% |
8.4% |
7.0% |
7.3% |
|
|
11.9 Atrial Fibrillation
Figure 11.5a: Atrial Fibrillation prevalence for males and females by age and ethnicity (self-assigned)
Figure 11.5b: Atrial Fibrillation prevalence for males and females by age and ethnicity (self-assigned and Origins-assigned)
Figure 11.5c: Atrial Fibrillation prevalence for all males and females by age and ethnicity (self-assigned, Origins-assigned and unknown imputed)
Table 11.6: Confidence limits for Atrial Fibrillation prevalence for all males and females by age and ethnicity (self-assigned, Origins-assigned and unknown imputed)
| |
Gender |
Age
group |
Bangladeshi |
Indian |
Pakistani |
Black |
Other |
White/British |
All ethnic groups |
LCL |
UCL |
LCL |
UCL |
LCL |
UCL |
LCL |
UCL |
LCL |
UCL |
LCL |
UCL |
LCL |
UCL |
Male |
40-49 |
0.1% |
1.2% |
0.1% |
0.3% |
0.1% |
0.4% |
0.2% |
0.5% |
0.0% |
0.4% |
0.3% |
0.7% |
0.2% |
0.4% |
|
50-59 |
0.0% |
1.0% |
0.4% |
0.9% |
0.3% |
0.8% |
0.1% |
0.7% |
0.1% |
0.8% |
0.8% |
1.4% |
0.5% |
0.8% |
|
60-69 |
0.7% |
5.9% |
1.1% |
2.4% |
0.3% |
1.2% |
0.3% |
1.3% |
0.7% |
3.3% |
2.7% |
3.8% |
1.8% |
2.4% |
|
70-79 |
0.9% |
4.7% |
2.5% |
5.0% |
2.3% |
4.2% |
2.3% |
4.2% |
2.5% |
6.9% |
7.9% |
10.3% |
4.8% |
5.9% |
|
80+ |
0.0% |
6.9% |
2.9% |
7.5% |
3.2% |
7.2% |
4.9% |
9.4% |
3.6% |
12.6% |
14.6% |
19.0% |
9.1% |
11.4% |
All males |
0.4% |
1.3% |
0.8% |
1.3% |
0.7% |
1.1% |
0.9% |
1.3% |
0.6% |
1.3% |
3.1% |
3.6% |
1.7% |
1.9% |
Female |
40-49 |
0.0% |
0.7% |
0.0% |
0.3% |
0.0% |
0.3% |
0.1% |
0.4% |
0.0% |
0.4% |
0.1% |
0.3% |
0.1% |
0.2% |
|
50-59 |
0.0% |
1.1% |
0.3% |
0.9% |
0.5% |
1.1% |
0.1% |
0.6% |
0.0% |
0.8% |
0.3% |
0.8% |
0.4% |
0.6% |
|
60-69 |
0.2% |
2.3% |
0.8% |
2.0% |
0.5% |
1.5% |
0.9% |
2.3% |
0.3% |
2.4% |
1.7% |
2.7% |
1.3% |
1.8% |
|
70-79 |
0.3% |
3.5% |
2.0% |
4.0% |
1.5% |
3.1% |
2.6% |
4.6% |
1.7% |
5.8% |
5.2% |
7.0% |
3.6% |
4.5% |
|
80+ |
0.7% |
18.0% |
3.3% |
7.4% |
2.3% |
5.8% |
4.0% |
7.8% |
3.9% |
12.7% |
10.5% |
13.5% |
7.8% |
9.7% |
All females |
0.2% |
0.8% |
0.8% |
1.3% |
0.7% |
1.0% |
1.0% |
1.4% |
0.6% |
1.3% |
2.8% |
3.3% |
1.5% |
1.8% |
Persons |
0.3% |
0.9% |
0.9% |
1.2% |
0.8% |
1.0% |
1.0% |
1.3% |
0.7% |
1.1% |
3.0% |
3.4% |
1.6% |
1.8% |
|
|
11.10 Hypertension
Figure 11.6a: Hypertension prevalence for males and females by age and ethnicity (self-assigned)
Figure 11.6b: Hypertension prevalence for males and females by age and ethnicity (self-assigned and Origins-assigned)
Figure 11.6c: Hypertension prevalence for all males and females by age and ethnicity (self-assigned, Origins-assigned and unknown imputed)
Table 11.7: Confidence limits for Hypertension prevalence for all males and females by age and ethnicity (self-assigned, Origins-assigned and unknown imputed)
| |
Gender |
Age group |
Bangladeshi |
Indian |
Pakistani |
Black |
Other |
White/British |
All ethnic groups |
LCL |
UCL |
LCL |
UCL |
LCL |
UCL |
LCL |
UCL |
LCL |
UCL |
LCL |
UCL |
LCL |
UCL |
Male |
40-49 |
10.9% |
15.7% |
16.5% |
19.1% |
8.7% |
10.4% |
10.8% |
12.7% |
7.5% |
10.1% |
7.5% |
8.9% |
10.6% |
11.4% |
|
50-59 |
23.9% |
33.0% |
37.2% |
40.7% |
25.3% |
28.3% |
22.5% |
26.1% |
21.2% |
26.6% |
20.4% |
22.8% |
26.5% |
28.0% |
|
60-69 |
42.9% |
58.9% |
53.0% |
58.1% |
39.0% |
44.5% |
44.8% |
50.8% |
36.4% |
45.9% |
38.9% |
42.0% |
43.5% |
45.7% |
|
70-79 |
54.9% |
67.0% |
65.5% |
71.7% |
50.9% |
56.3% |
71.8% |
76.6% |
60.7% |
70.7% |
56.9% |
60.9% |
61.5% |
63.9% |
|
80+ |
47.8% |
72.8% |
62.4% |
72.5% |
51.3% |
60.3% |
74.0% |
81.3% |
57.1% |
73.4% |
64.3% |
69.9% |
65.2% |
68.8% |
All males |
27.1% |
31.6% |
36.6% |
38.6% |
24.5% |
26.1% |
30.0% |
31.9% |
22.3% |
25.0% |
28.2% |
29.6% |
29.3% |
30.1% |
Female |
40-49 |
16.4% |
23.0% |
12.0% |
14.5% |
11.2% |
13.3% |
17.7% |
20.1% |
9.8% |
13.2% |
10.0% |
11.8% |
13.2% |
14.3% |
|
50-59 |
33.0% |
41.4% |
32.9% |
36.6% |
32.0% |
35.5% |
34.2% |
38.6% |
24.3% |
30.7% |
23.6% |
26.4% |
30.7% |
32.4% |
|
60-69 |
46.8% |
57.6% |
55.0% |
60.0% |
47.0% |
51.9% |
58.9% |
64.7% |
42.1% |
51.9% |
42.8% |
46.2% |
49.6% |
51.8% |
|
70-79 |
46.1% |
59.5% |
66.4% |
72.1% |
52.8% |
58.2% |
76.0% |
80.5% |
56.8% |
67.8% |
62.3% |
66.0% |
64.5% |
66.8% |
|
80+ |
35.0% |
69.3% |
68.2% |
76.5% |
48.5% |
57.7% |
76.9% |
83.4% |
57.1% |
72.8% |
70.8% |
74.8% |
69.5% |
72.5% |
All females |
34.1% |
38.8% |
36.7% |
38.8% |
30.8% |
32.6% |
39.6% |
41.7% |
26.4% |
29.7% |
36.3% |
37.8% |
35.7% |
36.6% |
Persons |
31.3% |
34.5% |
36.9% |
38.4% |
27.7% |
28.9% |
35.0% |
36.4% |
24.5% |
26.6% |
32.2% |
33.2% |
32.4% |
33.0% |
|
|
11.11 Stroke
Figure 11.7a: Stroke prevalence for males and females by age and ethnicity (self-assigned)
Figure 11.7b: Stroke prevalence for males and females by age and ethnicity (self-assigned and Origins-assigned)
Figure 11.7c: Stroke prevalence for all males and females by age and ethnicity (self-assigned, Origins-assigned and unknown imputed)
Table 11.8: Confidence limits for Stroke prevalence for all males and females by age and ethnicity (self-assigned, Origins-assigned and unknown imputed)
| |
Gender |
Age
group |
Bangladeshi |
Indian |
Pakistani |
Black |
Other |
White/British |
All ethnic groups |
LCL |
UCL |
LCL |
UCL |
LCL |
UCL |
LCL |
UCL |
LCL |
UCL |
LCL |
UCL |
LCL |
UCL |
Male |
40-49 |
0.2% |
1.3% |
0.3% |
0.8% |
0.3% |
0.6% |
0.3% |
0.7% |
0.1% |
0.6% |
0.3% |
0.6% |
0.3% |
0.5% |
|
50-59 |
0.9% |
3.8% |
1.3% |
2.2% |
1.2% |
2.1% |
0.9% |
1.9% |
0.8% |
2.3% |
1.3% |
2.1% |
1.4% |
1.8% |
|
60-69 |
1.5% |
7.9% |
2.8% |
4.8% |
3.4% |
5.7% |
3.0% |
5.4% |
2.6% |
6.6% |
3.9% |
5.3% |
3.9% |
4.7% |
|
70-79 |
7.7% |
15.5% |
8.5% |
12.6% |
6.7% |
9.6% |
6.9% |
9.9% |
5.6% |
11.4% |
7.5% |
9.8% |
8.0% |
9.4% |
|
80+ |
7.7% |
26.5% |
10.2% |
17.6% |
11.2% |
17.5% |
11.2% |
17.3% |
4.9% |
14.9% |
12.1% |
16.2% |
12.4% |
15.1% |
All males |
2.5% |
4.2% |
2.5% |
3.2% |
2.4% |
3.0% |
2.6% |
3.2% |
1.6% |
2.5% |
3.3% |
3.8% |
2.9% |
3.1% |
Female |
40-49 |
0.4% |
2.1% |
0.4% |
1.0% |
0.2% |
0.7% |
0.2% |
0.6% |
0.2% |
0.9% |
0.4% |
0.9% |
0.4% |
0.6% |
|
50-59 |
0.7% |
2.8% |
1.0% |
2.0% |
1.6% |
2.7% |
0.7% |
1.7% |
0.7% |
2.4% |
1.2% |
2.0% |
1.3% |
1.8% |
|
60-69 |
1.9% |
6.1% |
2.4% |
4.2% |
2.5% |
4.3% |
2.1% |
4.2% |
0.7% |
3.3% |
2.4% |
3.6% |
2.7% |
3.4% |
|
70-79 |
3.3% |
9.8% |
5.5% |
8.7% |
5.3% |
8.0% |
6.1% |
8.9% |
4.5% |
10.4% |
5.6% |
7.5% |
6.2% |
7.4% |
|
80+ |
0.0% |
12.7% |
7.4% |
13.0% |
7.9% |
13.5% |
7.6% |
12.4% |
10.4% |
22.4% |
9.6% |
12.4% |
9.6% |
11.7% |
All females |
1.6% |
3.0% |
2.3% |
3.0% |
2.3% |
2.9% |
2.2% |
2.8% |
1.7% |
2.7% |
3.2% |
3.8% |
2.7% |
3.0% |
Persons |
2.2% |
3.3% |
2.5% |
3.0% |
2.4% |
2.8% |
2.5% |
2.9% |
1.8% |
2.4% |
3.3% |
3.7% |
2.8% |
3.0% |
|
|
| |
|
Additional data
The detailed methodology (Appendix A) is presented within this report, please refer to the accompanying CD-ROM and Key Health Data website (http://www.bham.ac.uk/keyhealthdata) where further appendices are available.
Appendix B: Prevalence data in numerical - tabular format.
Appendix C: Base numbers used for prevalence calculations.
|
|
|
Reference:
- http://publicsector.experian.co.uk/Products/Mosaic%20Origins.aspx Accessed 24 June 2010.
APPENDIX A
Detailed methodology
1 Calculation of disease prevalence
Prevalences for each of the vascular diseases was calculated in each age/gender/ethnic group by the formula p = r/n, where p is the disease prevalence, r is the number of patients on the disease register in the specified age/gender/ethnic group and n is the total number of patients in the same age/gender/ethnic group.
2 Cultural Assignment
In the data for HoBtPCT practices, there were 137 codes for EMIS self-assessed cultural identity and 181 separate Origins labels. Several “pragmatic” attempts were made to group clearly identifiable cultural subgroups into sensible larger groups, and the following re-coding system agreed.
Enhanced Health Services regrouped the EMIS codes into the broad categories used in the 2001 Census. These were amalgamated into the following six categories: Bangladeshi, Pakistani, Indian/Other South Asian, Black, White/British and Other/Mixed/Not stated.
The Origins labels of the 23k patients with unrecorded EMIS ethnicity were examined to assess whether they could be grouped into the same ethnic categories. After some work validating Origins labels against ethnic codes in the full data set, it was decided that assignment of the Origins labels as given in Table 11.9 below was fairly reliable. Thus patients who had unknown cultural identity but any of these Origins labels were allocated to an ethnic grouping.
It is worth noting that the Origins label Bangladesh Muslim has been assigned to Pakistani rather than Bangladeshi ethnicity. On validation, disease prevalence profiles for Bangladesh Muslim origin were more similar to the profiles for Pakistani than Bangladeshi ethnicity. Across the whole dataset, more people with Bangladesh Muslim Origins label had self-assigned Pakistani ethnicity than any other.
3 Imputation of ethnicity for patients with unknown cultural identity
Using the methodology described above, it was possible to assign a cultural identity to 10,741 of the 22,751 with unknown ethnicity. However, there remained 12,010 patients with unknown ethnicity, including around 10,000 whose name was of English, Scottish or Welsh origin. Names from these countries of origin are particularly ambiguous since these patients could equally be of black or white ethnicity.
Ethnic categories were imputed for these patients by considering the distribution of self-assigned ethnic groupings of those with all ambiguous Origins labels across the whole dataset (see Table 11.10 below). The patients with unknown ethnicity were then distributed in the same proportions.
Table 11.9: Assignment of Origins labels to ethnic categories
| |
Origins label |
Recoded ethnic grouping |
INDIA SIKH |
Indian |
INDIA HINDI |
Indian |
INDIA PUNJABI |
Indian |
MUSLIM INDIA |
Indian |
INDIA JHARKAND |
Indian |
INDIA UTTAR PRADESH |
Indian |
INDIA MARATHI |
Indian |
INDIA RAJASTHAN |
Indian |
GOA |
Indian |
INDIA HIMACHAL |
Indian |
INDIA BENGALI |
Indian |
INDIA HARYANA |
Indian |
INDIA GUJARATI |
Indian |
INDIA ANDAMAN |
Indian |
INDIA KERALA |
Indian |
INDIA OTHER |
Indian |
INDIA TELUGU |
Indian |
SOUTH ASIA (UNSPECIFIED) |
Other South Asian |
SRI LANKA |
Other South Asian |
PAKISTAN |
Pakistani |
MUSLIM (UNSPECIFIED) |
Pakistani |
BANGLADESH MUSLIM |
Pakistani |
MOROCCO |
Pakistani |
PAKISTANI KASHMIR |
Pakistani |
MUSLIM OTHER |
Pakistani |
PAKISTANI NORTH |
Pakistani |
BANGLADESH HINDU |
Bangladeshi |
BLACK CARIBBEAN |
Black |
NIGERIA |
Black |
SOMALIA |
Black |
SIERRA LEONE |
Black |
GHANA |
Black |
BLACK SOUTHERN AFRICA |
Black |
USA BLACK |
Black |
ETHIOPIA |
Black |
ALGERIA |
Black |
SOUTH AFRICA : SHONA |
Black |
CONGO |
Black |
KENYAN AFRICAN |
Black |
AFRICAN (OTHER) |
Black |
ERITREA |
Black |
SENEGAL |
Black |
ZIMBABWE |
Black |
ANGOLA |
Black |
IVORY COAST |
Black |
SOUTH AFRICA : NDEBELE |
Black |
TANZANIA |
Black |
CHINESE CANTONESE |
Other |
CHINESE MANDARIN |
Other |
IRELAND |
White/British |
POLAND |
White/British |
NORTHERN IRELAND |
White/British |
USA WHITE |
White/British |
|
|
Table 11.10: Proportion of patients with unknown ethnicity assigned to each ethnic category
| |
Ethnic grouping |
Number |
Percentage |
White/British |
6,786 |
56.5 |
Black |
3,901 |
32.5 |
Indian/Other South Asian |
275 |
2.3 |
Pakistani |
272 |
2.3 |
Bangladeshi |
46 |
0.4 |
Other/mixed/not stated |
730 |
6.1 |
Total |
12,010 |
100.1* |
* 0.1% rounding error
|
|
4 Calculation of confidence limits for prevalence
Tables 11.2-11.8 show confidence limits for disease prevalence which have been applied using the Wilson Score method [Wilson EB. Probable inference, the law of succession, and statistical inference. J Am Stat Assoc 1927; 22:209-12], as recommended by the Association of Public Health Observatories [Eayres D. APHO Technical Briefing 3: Commonly used public health statistics and their confidence intervals, APHO March 2008].
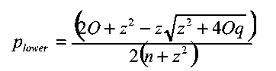
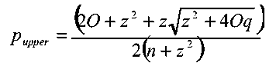
Formulas for upper and lower 100(1- a) % limits for the prevalence p are as follows:
Where O is the observed number of individuals in the PCT population with the specified disease;
n is the total number of individuals in the PCT population;
q = (1-p) is the proportion without the specified disease;
z is the 100(1- a/2)th percentile value from the Standard Normal distribution. For example for a 95% confidence interval,
a= 0.05, and z = 1.96 (i.e. the 97.5th percentile value from the Standard Normal distribution).
Table 11.11 Participating GPs in Heart of Birmingham Teaching Primary Care Trust
| |
Abhyanker US |
Majeed I |
Abrol V |
Marok IS |
Agarwal MD |
Melchior AM |
Ahmad ME |
Nandi DK, Bath SS, Latthe M, GK Hundle |
Ahmad Y, Ahmad N, Ahmad S, Ahmad A |
Nye MYL |
Ahmed B, Haroon AM |
O'Brien EF |
Ahmed F, Ruby A |
Ojukwu C I |
Ahmed R |
Pandit SS |
Alam MK |
Raghavan S |
Aston Pride Franchise |
Rajput VK, Rajput S |
Asylum Seekers Health Team |
Ramachandram RS |
Bansel JK |
Ramarao MV |
Bartley KM |
Ray S, Misra PK, Mukherjee S, Muralidhar R, Benn SVA, Joshi SM |
Bathla V |
Saini MS |
Bhalla SK |
Salim M |
Bhattacharyya B |
Shah SY, Mann AB, Poltock TL |
Brinksman S & Partners (Batra S, Conlon MH, Manley VC, Saunders PB, Hull MRP) |
Shah VM , Shah MJ |
Chaparala BC |
Sharma A |
Cheema MN |
Shaylor JL, Delaney BC, Harris GPM, Rati NK, Empson BD, Murdoch W, Iyengar PG |
ChilversMcCrea Healthcare |
Sidhom ATM |
Chitre RB |
Singh HJ |
Chunduri DR |
Sinha AK |
Dadheech VK, Dadheech HH |
Sinha ASP |
Deng ZB |
Sinha M |
Eccleston DB, Bailey KM, Harding NJ, Butler SP, Brewin T |
Soyannwo |
El-Sheikh OAA |
Summerfield Group Practice/Foundation |
Fawcett CJ, Alonzo KHR |
Thompson AP |
Firstcare Practice (Dr Rahman) |
Vatish RK |
Gaspar AS, Masood A, John A |
Verma SK, Zafar SA, Zafar A |
Gini PC |
Walji MTI |
Hafeez A, Hafeez F |
|
Hall MG, Jassel GS, Mavi BS |
|
Hyman BM |
|
Karamdad DR, Ali Z |
|
Karzoun FK, Gill SK |
|
Kathuria UC |
|
Khan MA |
|
Khattak SH, Khattak SS |
|
Kulshrestha RP, Kulshrestha S |
|
Madhavan P |
|
|
|
| |
|
Acknowledgements
With thanks to Dr Mary Orhewere for editing this chapter, the GPs participating in the Deadly Trio project (Table 11.11) and Enhanced Health Services (Steve Riley)
|
|
|
|