West Midlands Key Health Data 2007/08
CHAPTER TWO: COMPARING THE 2004 AND 2007 INDICES OF DEPRIVATION
Samuel Jones and Diane Edwards
Main Body
7: Healthcare Associated Infections (HCAI)
|
2.1 Introduction
The English Indices of Deprivation 2007, which were published in December 2007, allow for the first time a comparison to be made between ID 2004 and ID 2007.
In light of the Guidance Paper ‘Using the English Indices of Deprivation 2007’ (1), which states that “Index scores from 2004 cannot be compared with those from 2007”, this chapter will only look at changes in national rank as a means of comparison and not scores.
The chapter is divided into three sections and aims to primarily describe the change in the ranks of Indices of Deprivation, and only in Section Three does it describe areas of deprivation.
It is important to note that since the Indices are relative to other Lower Super Output Areas (LSOAs) in England, an area which has seen a change in rank (for better or for worse) does not necessarily mean it is getting more or less deprived.
Section One: focuses on national rank positions (where 1 is the most deprived) and the change experienced in average rank, showing regional comparisons in England before looking at change specifically within the West Midlands. This analysis covers all domains (see extended chapter on accompanying CD-ROM).
Section Two: provides further analysis within the region by specifically looking at PCT-level (based on 2006 boundaries), and their respective changes in terms of a population-weighted average rank change. (Note: due to the calculation of population-weighted average ranks, the ranks for this measure have been inverted: i.e. 1 is now the least deprived.)
Section Three: shows the most deprived LSOAs within the region, containing 10% of the region’s population (based on 2001 census population for the 2004 indices and mid-2005 population estimates for the 2007 indices). This measure can help identify regional ‘hotspots’ of deprivation and describes how these have changed between the 2004 and 2007 Indices. These results have also been summarised according to PCT (using 2006 boundaries).
Section One - Changes in National Rank
2.2 Index of Multiple Deprivation
Figure 2.1: Average change in rank per LSOA for Index of Multiple Deprivation by Government Office Region
|
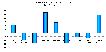
The average rank change, per LSOA, for the West Midlands has seen a decrease (i.e. worsening) in rank of 286.5, a change that is comparable to that of the South West. The West Midlands is one of five regions to have shown an average decrease. In comparison the Yorkshire & Humber and North East regions have seen the greatest improvement in terms of average rank per LSOA.
Map 2.1: Changes in National Rank ID 2004 and 2007: Index of Multiple Deprivation
|
Of all the 3,482 LSOAs in the West Midlands: 61.1% have decreased in rank, 38.8% have improved in rank and three LSOAs have remained at exactly the same rank. The areas that have seen the biggest declines in rank are mainly located in the West, and in the more rural areas of the region, in particular Herefordshire.
2.3 Summary of average LSOA change in rank by GOR for all domains
The table below summarises the findings in terms of average rank change per LSOA by Government Office Region for each domain:
Table 2.1: Summary table showing average change in rank per LSOA for all domains, by Government Office Region
|
The greatest change that has occurred in the West Midlands region has been in the Barriers to Housing and Services Domain – which has seen by far the biggest decrease out of all the regions and the greatest change out of all the domains.
The Crime domain has experienced the second biggest change in the West Midlands and has seen a significant improvement, in fact seeing the biggest increase amongst all the regions in the country.
The West Midlands is one of just two regions to have seen average change for the Education, Skills & Training Domain to have improved, whilst it has also seen some improvement in both the Employment and Living Environment domains.
Section Two
2.4 A Comparison of the Indices at PCT- Level within the West Midlands
Figure 2.2: Population-weighted average rank per LSOA for Index of Multiple Deprivation by PCT
|
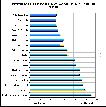
Herefordshire PCT has experienced the greatest change and indeed seen its average rank worsen the most.
Only four PCTs (South Birmingham, Solihull Care Trust, North Staffordshire and Coventry) have seen their average rank improve.
The top three most ‘deprived’ PCTs – Heart of Birmingham, Sandwell, and Birmingham East & North – have remained so for both 2004 and 2007 indices.
Figure 2.3 below shows the rank change for each PCT per domain:
Figure 2.3: Change in population-weighted average rank per LSOA for all domains by PCT
|
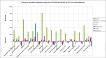
The West Midlands’ overall poor performance in the Barriers to Housing domain (Table 2.1) is reflected by each PCT, which have all shown high levels of decline – most notably in Sandwell and Dudley. Even those PCTs which have shown good overall improvement (such as Solihull and North Staffordshire) have still shown to be to be deteriorating greatly in this domain.
Hereford’s overall poor performance can perhaps be attributed to its extremely poor performance, in the Living Environment domain - in which it has declined in rank by some 5,000. This is in stark contrast to the performance of the other PCTs in this domain.
The region’s good performance in the Crime domain (Table 2.1) is reflected by the fact that all but three PCTs have shown levels of improvement in this domain.
Section Three Regional Hotspots
2.5 Index of Multiple Deprivation
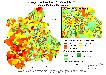
Map 2.2: Indices of Deprivation 2004 and 2007: Index of Multiple Deprivation Regional Hotspots within the West Midlands
|

The ‘hotspots’ of deprivation in the region, for the overall IMD measure, have seen little change and are generally located in the Region’s main urban areas (Birmingham and the Black Country, Coventry and Stoke-on-Trent).
Results are summarised below, where it is evident that Birmingham East & North has seen the biggest increase.
Table 2.2: Index of Multiple Deprivation 'hotspots' by PCT
|
Both Birmingham East and North and Sandwell PCTs have shown the biggest percentage increase of identified hotspots.
Despite Stoke-on-Trent PCT and Wolverhampton City PCT experiencing the biggest decreases in identified hotspots they both remain in the top five.
References and Further Reading:
- The English Indices of Deprivation 2007, Data and publications available from:
http://www.communities.gov.uk/communities/neighbourhoodrenewal/deprivation/deprivation07/ - The English Indices of Deprivation 2004, Data and publications available from:
http://www.communities.gov.uk/archived/general-Content/communities/indicesofdeprivation/216309/