West Midlands Key Health Data 2007/08
CHAPTER EIGHT: DIABETES IN THE WEST MIDLANDS
LA level dataSharon Walton
Main Body
7: Healthcare Associated Infections (HCAI)
8.1 Introduction
Diabetes affects people of all ages, it is a leading cause of blindness in the UK and the number of people affected by diabetes is increasing. Diabetes has a huge impact on life expectancy with Type 1 diabetes reducing an individual’s life expectancy by at least 15 years and Type 2 diabetes by up to 10 years(1). It is estimated the NHS spend around 5% of its budget to care for people with diabetes(1).
8.2 Prevalence
The global picture
Globally in 2000 it was estimated that 171 million people had diabetes (a prevalence of 2.8%)(2), by 2030 this number is expected to rise to 366 million people (a prevalence of 4.4%). 90% of these people have Type 2 diabetes (resulting from the body’s ineffective use of insulin). India, China and the USA have the highest numbers of people with diabetes worldwide.
The national picture
In England 2,262,484 (3) (4.48%) people were estimated to have had diabetes in 2005.
The regional picture
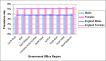
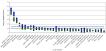
The West Midlands is estimated to have one of the highest prevalence rates in the country from Type 1&2 diabetes (Figure 8.1). The prevalence of diabetes is higher in Females than Males.
Figure 8.1: Estimated prevalence and number of people with diabetes, 2005 by Government Office Region
|
The PBS model generates expected total numbers of persons with Type 1 and 2 diabetes (both undiagnosed and diagnosed combined) in 2005. The model applies age/sex/ethnic group specific estimates of diabetes prevalence rates, derived from epidemiological population studies, to 2005 resident populations.
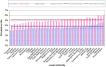
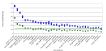
Figure 8.2: Estimated prevalence and number of people with diabetes, 2005, by Local Authority
|
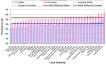
The more urban Local Authorities have the highest rates of diabetes in the region, with Wolverhampton LA nearly a whole percentage greater than the England average.
Type 1 diabetes occurs due to the body’s own autoimmune response which causes the destruction of insulin producing cells, treatment is by insulin injections. Type 1 diabetes is usually identified in the teen years.
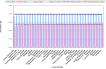
Type 1 diabetes accounts for between 5.8 – 9.1% of all people with diabetes. The prevalence rates of Type 1 diabetes are roughly the same across the regions, within the West Midlands there is also little variation.
Figure 8.3: Estimated prevalence and number of people with Type 1 diabetes, 2005, by Government Office Region
|
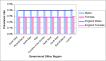
Figure 8.4: Estimated prevalence and number of people with type 1 diabetes, 2005, by Local Authority
|
Type 2 diabetes occurs due to insufficient amounts of insulin being produced. It is largely managed by diet. Type 2 diabetes occurs largely in adults but is becoming increasingly seen in younger age groups due to higher levels of obesity. Type 2 diabetes accounts for between 85 – 95% of all people with diabetes.
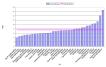
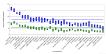
The West Midlands region has the highest estimated prevalence of diabetes in the country, above the England average for both males and females. Within the West Midlands, Wolverhampton, Sandwell and South Shropshire are highest with an estimated prevalence of around 5% for females and 3.5% for Males.
Figure 8.5: Estimated prevalence and number of people with Type 2 diabetes, 2005, by Government Office Region
|
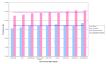
Figure 8.6: Estimated prevalence and number of people with Type 2 diabetes, 2005, by Local Authority
|
8.3 Obesity trend data linked in with diabetes
The Information centre for health(4) report that the risk of developing Type 2 diabetes is 13 times more likely in obese women than non obese women and 5 times more likely in obese men compared to non obese men.
In England in 2006, 24.9% of males and 25.2% of females were classed as obese (BMI >30)(5). In the Health Survey for England 2003, 23% of males and 28.7% of females in the West Midlands region were reported as obese.
The PBS model estimates the prevalence of diabetes in 2001 and 2010 using different obesity scenarios. Figure 8.7 shows that even if the obesity trend stays static, there will still be an increase in the prevalence rate of diabetes. The West Midlands has one of the highest prevalence rates in England.
Figure 8.7: Estimated prevalence of diabetes (type 1 and 2 diagnosed and undiagnosed) in 2001 and 2010 modelled using PBS with different obesity scenarios, by Government Office Region
|
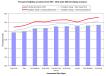
Figure 8.8: Estimated prevalence of diabetes in 2001 and 2010 modelled using PBS with different obesity scenarios, by Local Authority
|
8.4 Diabetes related hospitalisations
In 2006/07 there were over 7,000 admissions to hospital within the West Midlands where diabetes was classed as a primary cause.
Table 8.1: Directly Standardised Admission Rates and numbers for Diabetes (ICD10 E10-E14), All ages, Males & Females, 2006/07
| ||||||||||||||||||||||||||||||||||||||
Source: HES, Mid year 2006 population estimate | ||||||||||||||||||||||||||||||||||||||
Figure 8.9: Directly Standardised Admission Rates for Diabetes (ICD10 E10-E14) by Primary Care Trust, All ages, Males & Females, 2006/07
|
8.5 Diabetes related emergency hospital admissions
There were over 3,500 diabetes related emergency admissions to hospital within the West Midlands between 2006/07. Half of all admissions for diabetes are emergency. This is lower than nationally where over 60% of admissions are emergency.
Table 8.2: Directly Standardised Emergency Admission Rates and numbers for Diabetes (ICD10 E10-E14), All ages, Males & Females, 2006/07
| ||||||||||||||||||||||||||||||||||||||
| ||||||||||||||||||||||||||||||||||||||
Figure 8.10: Directly Standardised Emergency Admission Rates for Diabetes (ICD10 E10-E14) by Local Authority, All ages, Males & Females, 2006/07
|
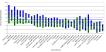
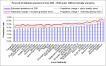
Figure 8.11: Proportion of admissions that are emergency admissions by Local Authority 2006/07
|
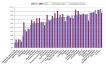
Figure 8.11 shows there is wide variation between the local authorities, Newcastle-under-Lyme have a low percentage of admissions that are emergency (12% for Males, 19% for Females) whereas Coventry have a much higher percentage (95% for Males, 86% for Females).
8.6 Average length of stay for diabetes
The average length of stay for all diabetes admissions in the West Midlands is 7.6 days.
In people with diabetic foot disease, a strategy in Southampton managed to reduce the length of stay for patients from an average of 50 days to 18.5 days, they estimated this has saved them £2.2 million over the first 22 months of the project. They managed to achieve this by introducing a multidisciplinary Diabetes Foot Protection Team.(6)
Figure 8.12: Average length of stay for diabetes patients in the West Midlands, LA, 2006/07
|
8.7 Diabetes complications data
Diabetes complications can be broadly put into three categories, Macrovascular, Microvascular and Other. The diabetes commissioning toolkit7 breaks this down as shown in the table below.
|
The number of admissions with diabetic complications have been obtained from the Hospital Episode Statistics (HES). The admissions were derived from records where the primary diagnosis was diabetes (ICD10 E10- E14) and secondary diagnosis was one of the complications above and also where the primary diagnosis was the complication and diabetes was recorded as a secondary diagnosis.
Table 8.3: Number of diabetes complications in the West Midlands, 2004/05, 2005/06, 2006/07 pooled
| |||||||||||||||||||||||||||||||||||||||||||||||||||||||||||||||||||||||||||||||||||||||||||||||||||||||||||||||||||||||
Source: HES; ONS mid year population estimates (2004, 05, 06) | |||||||||||||||||||||||||||||||||||||||||||||||||||||||||||||||||||||||||||||||||||||||||||||||||||||||||||||||||||||||
8.8 All diabetic complications (as outlined in the table)
In 2006/07 there were over 12,700 hospital admissions with diabetic complications within the West Midlands.
Figure 8.13: Directly Standardised Admission Rates for Specified diabetic complications* by Local Authority, All Ages, Males & Females, 2004/05 2006/07 pooled
|
* Specified complications include: Cerebrovascular disease, Ischaemic heart disease, peripheral arterial disease, retinopathy, nephropathy, neuropathy, depression, amputation, erectile dysfunction, problems in pregnancy – See appendix for ICD10 codes used.
The next few charts show the rates of diabetic complications by type of complication and broken down by local authority. As actual numbers are small the graphs have wide confidence intervals so caution should be taken when interpreting the results.
8.9 Cerebrovascular disease
The diabetic population are more at risk of developing a cerebrovascular complication if their blood pressure is not managed properly and is too high.
Figure 8.14: Directly Standardised Admission Rates for Cerebrovascular complications with Diabetes (ICD10 I60 - I69 with ICD10 E10-14) by Local Authority, All Ages, Males & Females, 2004/05 2006/07 pooled
|
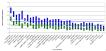
Figure 8.14 shows the rate of the local authority population admitted to hospital with a cerebrovascular complication as either a primary or secondary diagnosis with diabetes as either a primary or secondary diagnosis. It is evident that there is wide variation across the region where the rate of admission in Sandwell for diabetics with a cerebrovascular complication is roughly 5 times greater than Solihull who have the lowest rate for the combined years 2004/05 – 2006/07.
8.10 Ischaemic Heart Disease
Diabetics are at risk of ischaemic heart disease if their diabetes is not managed properly as high levels of blood glucose can lead to clogging of the arteries.
Figure 8.15: Directly Standardised Admission Rates for Ischaemic Heart Disease complications with Diabetes (ICD10 I60 - I69 with ICD10 E10-14) by Local Authority, All Ages, Males & Females, 2004/05 2006/07 pooled
8.11 Deaths from diabetes
In the West Midlands over 700 people die each year as a result of diabetes.
Table 8.4: Directly Standardised Mortality Rates and numbers for Diabetes (ICD10 E10-E14) All ages, Males & Females, 2002-2006
| |||||||||||||||||||||||||||||||||||||||||||||||||||||||||||||||||||||||||||||||||||||||||||||||||||||||||||||||||||||||||||||||||||||||
Source: ONS mortality files, experimental mid year PCT population estimates | |||||||||||||||||||||||||||||||||||||||||||||||||||||||||||||||||||||||||||||||||||||||||||||||||||||||||||||||||||||||||||||||||||||||
Figure 8.16: Directly Standardised Mortality Rates for Diabetes Mellitus (ICD10 E10-E14) by Local Authority, All ages, Males and Females, 2002-2006 pooled
|
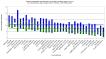
Figure 8.17: Directly Standardised Mortality Rates for Diabetes (ICD10 E10 E14), All ages, Males and Females, 2002 2006
|
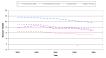
Figure 8.17 shows that the death rate from diabetes has been reduced at a regional level as well as nationally.
8.12 Where are we now data highlights for the West Midlands from the YHPHO tool
Table 8.5: Summary of diabetes measures data
| |||||||||||||||||||||||||||||||||||||||||||||||||||||||
Source: Where are we now? YHPHO commissioning toolkit for diabetes | |||||||||||||||||||||||||||||||||||||||||||||||||||||||
Data source come from: Compendium of Clinical and Health Indicators, Health and Social Care Information Centre, Health Surveys for England, The Information Centre for health and social care, Prescribing Support Unit, Healthcare Commission Survey of People with Diabetes 2006 |
|||||||||||||||||||||||||||||||||||||||||||||||||||||||
|
APPENDIX 1 Definitions used to look at complications
The question our data has answered is the number of in year admissions with diabetic as a primary cause and complications as a secondary cause or diabetic as secondary cause and complications as a primary cause.
|
References:
- Department of Health - About Diabetes [Online]. 2007 [Cited February 2008]. Available from URL: http://www.dh.gov.uk/en/Healthcare/NationalServiceFrameworks/Diabetes/DH_074762
- Wild S, Roglic G, Green A, Sicree R, King H. Global Prevalence of Diabetes - Estimates for the year 2000 and projections for 2030.Diabetes Care 2004; 27:1047-1053
- Yorkshire and Humber Public Health Observatory, Brent Primary Care Trust, & School and Health related research, University of Sheffield, PBS Diabetes Population Prevalence Model - Phase 2 [online]. 2005 [cited 12th January 2008]. Available from URL: http://www.yhpho.org.uk/PBS_diabetes.aspx
- The Information Centre for Health, Statistics on obesity, physical activity and diet, England 2006 [Online]. 2006 [Cited February 2008]. Available from URL: http://www.ic.nhs.uk/statistics-and-data-collections/health-and-lifestyles/obesity/statistics-on-obesity-physical-activity-and-diet-england-2006
- The Information Centre 2006, Health Survey for England 2006.
- National Diabetes Support Team - Cutting length of stay in Southampton [Online]. 2007 [Cited February 2008]. Available from URL: http://www.diabetes.nhs.uk/downloads/infopoint_length_of_stay.doc
- Department of Health - Diabetes commissioning toolkit [online]. 2006 [Cited April 2007]. Available from URL: http://www.dh.gov.uk/en/Publicationsandstatistics/Publications/PublicationsPolicyAndGuidance/DH_4140284