West Midlands Key Health Data 2007/08
CHAPTER SIX: CHILDHOOD CANCER IN THE WEST MIDLANDS
A REPORT FROM THE WEST MIDLANDS REGIONAL CHILDREN’S TUMOUR REGISTRY (WMRCTR)Sheila Parkes and Dr Judy Powell
Main Body
7: Healthcare Associated Infections (HCAI)
6.1 Introduction
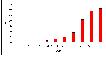
Cancer is predominantly a disease of the elderly; in 2005, 71% of cases developed in people over the age of 60 (1). Childhood cancer (i.e. occurring in those under 15 years) is a very rare disease, accounting for only 0.5% of all cancers at all ages (Figure 6.1).
Figure 6.1: All cancers England & Wales (childhood cancer 0-14 years)
|
It is estimated that in developed countries 1 in 650 children will develop cancer before the age of 15 (2), compared with asthma, where the figure is closer to 1 in 8. The causes of childhood cancer are not well understood, unlike the adult scenario, where cancer is largely accepted to be a disease of old age, when cell division becomes less efficient, or is related to lifestyle and environmental factors such as smoking, exposure to carcinogenic substances etc.
Childhood malignancy is very different from that seen in adults, particularly in histological subtype, in that most adult cancers are carcinomas, whereas these tumours are exceedingly rare in children (<4%). Conversely, many childhood tumours are never seen in adults, as they develop in the immature cells of the developing tissue (-“blastomas”). Most paediatric malignancies are detected earlier than those in adults and response to treatment is also very different, resulting in superior survival rates.
Research into childhood cancer has been hampered by the relatively small numbers involved and therefore it is vital that all cases are recorded. The UK cancer registration scheme is acknowledged to be one of the best in the world for ascertainment and in addition, there is a separate National Register of Childhood Tumours (3), which obtains notifications from all of the main regional Registries and Cancer Intelligence Units, as well as from the 21 centres which specialise in the treatment of childhood malignancies.
There are also 5 English regional childhood cancer registries (North-West, Yorkshire, Northern, West Midlands and South-West) which record and analyse the cases in their areas. These specialist registries are able to collect extra information and undertake in-depth analyses on their small number of cases, unlike the main regional registries which of necessity handle huge volumes (the West Midlands Cancer Intelligence Unit receives around 35,000 notifications per year, compared with approximately 1,450 recorded by the National Register of Childhood Tumours in Oxford). The following chapter has been prepared by the West Midlands Regional Children’s Tumour Registry (WMRCTR), which was established in 1984 at Birmingham Children’s Hospital NHS Foundation Trust (BCH), and holds data on all cases since 1957. Thus the WMRCTR is able to undertake analyses on over 50 years’ worth of data on this rare disease
6.2 Incidence trends
A previous report(4) presented data for the West Midlands from 1994-2003; this report will include the years 1997-2006. There were 1,288 cases of malignancy and benign brain tumours diagnosed in this latest period in West Midlands residents aged less than 15 years. In 2000, there were 1,400 new cases diagnosed in Great Britain, giving a national age-standardised incidence rate (ASR) of 139 per million per year(3). In the West Midlands, the ASR for 1997-2006 for all types of cancers together was 131.4 per million per year (95% CI 124.1 -138.7), compared with 131.8 for 1994-2003, showing that there has been no increase in incidence. Figure 6.2 shows the individual annual ASRs for the later period, for the whole region, demonstrating no general increase.
Figure 6.2: ASR 1997-2006 all West Midlands childhood cancers
|
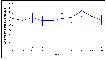
Table 6.1 shows the 1997-2006 ASRs for the West Midlands SHA and for the 5 counties which comprise it. Cancer rates are lowest in Shropshire and highest in Hereford and Worcester, although these differences are not significant.
Table 6.1: West Midlands 1997-2006: incidence of childhood cancer by county (per million per year)
|
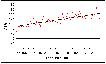
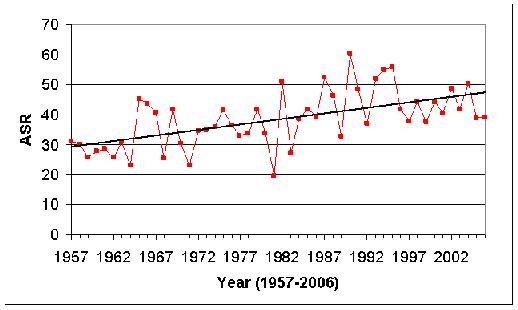
Examination of the whole 50-year period (Figure 6.3) reveals a significantly rising rate (p<0.001), of one extra case, year on year. If we divide the period into 2 25-year cohorts, the rise is still statistically significant in each (p=0.008 for 1957-82; p<0.001 for 1983-2006).
Figure 6.3: ASRs for all West Midlands childhood cancers 1957-2006
|
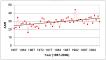
Leukaemia is the most common form of childhood cancer in developed countries, accounting for around one third of cases. This compares with the adult picture, where leukaemia is seen in less than 10% cases. There has also been a highly significant increase in incidence in the West Midlands over the 50 years since 1957 (p<0.0001), representing an increase of 0.37 cases per year (Figure 6.4a). However, on further analysis, in the first 25 years to 1981, although the increase in incidence was significant (p=0.001), from 25–45 cases per year, in the second 25 year period, there was no significant increase (p=0.195, 40-49.7 cases per year), as illustrated by the 3-year rolling averages (Figure 6.4b). There could be several explanations for the early escalation in incidence rates, as well as a genuine increase, such as improved cancer registration efficiency, more sophisticated diagnostic techniques, or even changes in post-mortem practice. This underlines the importance of caution in interpreting temporal trends in disease incidence.
Figure 6.4a: Leukaemia - Annual ASRs plus linear trend, 1957-2006
|
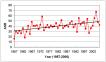
Figure 6.4b: Leukaemia - Annual ASRs 3-year rolling average, 1957-2006
|
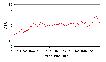
Brain and central nervous system (CNS) tumours are the most common solid tumour of childhood, second in incidence to leukaemia, accounting for around 25%, and here too there has been a significant increase (p<0.001) since 1957 (Figure 6.5).
European surveillance data is available through EWGLI and identifies the country where the report of Legionnaires’ disease originates from.
Figure 6.5: ASRs for West Midlands brain and CNS tumours 1957-2006
|
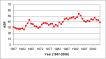
The incidence of childhood lymphoma (Hodgkin and non-Hodgkin) has also risen significantly over the whole period (p<0.001) and in each of the 25-year periods (p=0.05 and 0.012). Finally, the increase in incidence of other solid tumours is also significant over the 50 years (p<0.001), although only the second era (1983-2006) shows a significant rise (p=0.02) (Figures 6.6).
Figure 6.6a: Solid tumours Annual ASRs plus linear trend 1957-2006
|
Annual ASRs plus linear trend (gradient for trend = + m0.37 cases per year: R2 = 0.33)
Figure 6.6b: ASRs for West Midlands solid tumours 1957-2006: 3-year rolling average
|
6.3 Sex and Age
Childhood cancer is universally more prevalent in boys than girls 3, which is borne out by the West Midlands figures for 1997-2006, in which 55% were boys, although some non-gonadal cancers are more common in girls (e.g. adenocarcinoma of the adrenal and thyroid glands). Certain other tumour types, such as Non-Hodgkin lymphoma, are more common in boys.
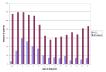
Almost half of all paediatric malignancies occur in the under 5s, reflecting the fact that they develop in primitive cells. The most common type of leukaemia, acute lymphoblastic leukaemia (A.L.L.), which represents 80% of all childhood leukaemias, has its age peak between 2-3 years of age. The West Midlands age breakdown of all tumours, illustrating A.L.L. separately, is shown in Figure 6.7, showing that our age distributions follow these general trends.
Figure 6.7: Age distribution of West Midlands childhood malignancies, showing peak in A.L.L. incidence
|
6.4 Ethnic incidence and Trends
The West Midlands has a large ethnic population: 10.9% of children were of South Asian origin and 2.1% black in the 2001 census. In the period 1997-2006, there were 168 (13%) cases of cancer in South Asian children and 31 (2.4%) in black children. Certain patterns, both excesses and deficits, have previously been observed in particular tumour types in Asian children (5), in a study of the cases diagnosed 1982-91. Overall, Asian children had higher rates of cancer than white children (ASRs of 163.9 and 130.9 respectively, p<0.05, SRR 1.22) and showed statistically significant excesses of lymphomas and germ cell tumours, as well as a deficit of brain and CNS tumours. In the 4-year period 1989-92, the overall ASR was unchanged at 131/million/year in white children, but was even higher (186.7) in the Asians (p<0.05).
We have now been able to analyse more ethnic data in 2 periods 1987-96 and 1997-2006 (Table 6.2), using ethnic population figures from the 1991 and 2001 censuses respectively. The results from the former period largely support the conclusions previously described, of higher overall and certain specific (particularly Hodgkin lymphoma and germ cell tumour) rates. Analysis of the 2nd period, 1997-2006 shows that the Asian rates are becoming more like those of the white children, in that, although the overall rates are higher, this is no longer significant (SRR 1.18). The rates of soft tissue sarcomas are now similar to those of the white children and the deficit seen in brain and CNS tumours has now disappeared. Rates of retinoblastoma (a tumour of the eye) are still higher but non-significant and the excess of germ cell tumours has also disappeared. Apart from lymphoma, where the rates are still significantly higher (SRR 2.02), other rates – leukaemias, brain/CNS and other solid tumours – are all approximately 10% higher than in white children (although non-significant). The reason for this is unclear, but one suggestion is that it might represent under-counting of the Asian population denominator.
Table 6.2a: ASRs for cancer in White and South Asian children in Birmingham HA 1987-96
* - standardised rate ratio – ratio of the ASR in South Asians cf. the ASR in Whites. |
|||||||||||||||||||||||||||||||||||||||||||||||||||||||||||||||||||||||||||||||||||||
Population figures derived from the 1991 census, when Whites comprised 85.6% and South Asians 9.7% of the childhood population of West Midlands SHA.
Table 6.2b: ASRs for cancer in White and South Asian children in Birmingham HA 1997-2006
* - standardised rate ratio – ratio of the ASR in South Asians to the ASR in Whites. |
|||||||||||||||||||||||||||||||||||||||||||||||||||||||||||||||||||||||||||||||||||||
Population figures derived from the 2001 census, when Whites comprised 82.5% and South Asians 10.9% of the childhood population of West Midlands SHA.
6.5 Social deprivation
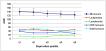
The influence of social deprivation on childhood cancer incidence was investigated using the Index of Multiple Deprivation (IMD) – an area-based deprivation measure derived from the 2001 census. The West Midlands SHA contains 3,482 super output areas (SOAs), each containing between 50 and 850 (average = 295) children under 15. These SOAs were ranked according to their IMD score, and then aggregated into quintiles, each quintile containing a 5th of the SHA’s childhood population. Cancer cases were then linked, via their postcode and SOA to the appropriate quintile, and age-standardised cancer incidence rates derived for each quintile. The results are shown in Figure 6.8.
Whilst the 95% confidence intervals reveal that there is no significant difference in cancer incidence between the five areas, a significant trend in the rates is apparent (p = 0.003). Cancer rates increase as deprivation score decreases, and the rate in the 20% of children who reside in the most affluent SOAs is 13% higher than the rate in children living in the most deprived SOAs (Standardised Rate Ratio=1.13; 95% CI= 0.95-1.35). The reasons for this gradient are unknown. However, an association between acute lymphoblastic leukaemia (where viral exposure is a suspected cause) and higher social class has previously been demonstrated (6).
Figure 6.8: West Midlands cancer incidence by deprivation quintiles
|
6.6 Survival
Childhood cancer is the leading cause of death from illness in the paediatric age-group and in 2000, it was responsible for 20% of all childhood deaths. However, owing to major advances in treatment, notably in chemotherapy regimens, since the 1970s, over 75% of all children with cancer can now be called cured, having reached 5 years’ survival from diagnosis. This compares with around 25% in the 1960s. At the end of 2000, there were over 26,000 survivors of childhood cancer in the UK (7).This contrasts with the situation in adult cancer, where less than half of men and less than a third of women survive for 5 years.
Contributing to this dramatic increase in childhood survival has been the centralisation of care into 21 UK centres under the auspices of the Children’s Cancer & Leukaemia Group (CCLG), resulting in increased recruitment into clinical trials, such that almost 90% of eligible patients take part. In the West Midlands, BCH has been the regional referral centre since the early 1970s, and survival rates in the region have also improved significantly (8).
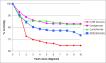
Figure 6.9 shows the survival rates for childhood cancers 1997-2006 by diagnostic type (the graph has been expanded in order to separate the lines). This illustrates that brain and CNS tumours have the lowest survival rate, at around 65%. However, this is somewhat misleading, as there are several types of brain tumour in the paediatric age-range, each with its own survival rate, ranging from 100% for low-grade astrocytoma, which is usually successfully treated with surgery alone to around 30% for brain stem tumours which are mostly inoperable. Leukaemia has the highest survival rate, of over 80%, a dramatic increase from the 1960s, when 5-year survival was less than 5%. Lymphomas, mainly Hodgkin lymphoma, have a similarly high survival rate. The apparent fall in survival from solid tumours after 8 years is likely to be a statistical artefact.
Figure 6.9: West Midlands childhood cancer survival 1997-2006 by diagnostic type
|
6.7 Follow-up
Now that survival rates are generally so high in childhood cancer, the study of long-term effects is of paramount importance. These can range from minor cosmetic issues to more serious consequences such as cardiac problems in later life, as well as intellectual impairment and growth disturbance. Since these are usually the result of the treatment of the original disease, e.g. mutilating surgery, intensive chemotherapy and irradiation, research into the late effects of the disease can influence the development of treatment regimens for future patients.
BCH has instituted a progressive pathway of follow-up, whereby patients are seen in clinics at BCH until they reach 16, when they are seen in “transition” clinics for 2 years, preparing them for the dedicated adult long-term follow-up clinics at University Hospital, Selly Oak. It is hoped that, by being offered monitoring in adult clinics by specialists in childhood cancer treatment who are aware of the potential late effects of their disease and treatment, they will continue to attend for many years.
However, it has become evident that not only is it unnecessary for patients with low-grade disease to attend clinics, but many of them do not wish to do so. The increase in the number of survivors over the last 30 years has meant an escalating workload for the follow-up clinics, so many patients have been discharged to the care of their GPs. Added to these are those who have moved away from the region, who have defaulted from clinic attendance, and who were never treated at BCH in the early years. In order to maintain surveillance of these patients, the WMRCTR has established a system of postal follow-up, whereby health and social information is sought from the GP via a questionnaire every 3 years.
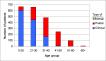
Figure 6.10 shows the current ages of the survivors on both clinical and postal follow-up, revealing that, as expected, the older survivors are no longer attending clinics. Analysis of the first 10 years’ results of the postal follow-up system (9) on patients diagnosed from 1957 revealed a GP response rate of 85.8%, with no difference between those GPs inside and external to the West Midlands (87% and 84.5% respectively). At the end of 2006 there were 1,220 patients attending clinics and 935 patients on postal follow-up, with ages ranging from 5-62 years. Not all of these latter are free from health problems, which has implications for primary care as well as hospital workload.
Figure 6.10: Current age of survivors on active follow-up
|
Almost three-quarters (74%) of patients had at least one medical problem and, as might be expected, brain tumour survivors had the greatest number of problems per patient. Figure 6.11 illustrates the long-term effects experienced by all survivors, broken down into the major groups, with some examples of single problems within 3 groups. It can be seen that endocrine dysfunction was the most common problem, experienced by 26% of patients. Table 6.3 shows the percentage of problems affecting survivors according to the treatment they received and it is immediately obvious that those undergoing all 3 modalities are the worst affected, with those having chemotherapy alone experiencing the fewest problems.
Figure 6.11: Types of problem experienced by survivors
|
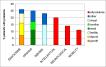
Table 6.3: Health problems by treatment modality
|
6.8 Second malignancies
One of the more uncommon consequences of childhood cancer is the development of a second primary tumour, either in the paediatric age-group or, more usually, much later in adulthood. These are mostly related to the treatment of the original disease, i.e. radio- or chemotherapy; osteosarcoma (bone tumour) after retinoblastoma (eye tumour) and basal cell carcinoma (skin cancer) after irradiation, and leukaemia after chemotherapy occur frequently. In some instances there is a genetic component, leading to a predisposition to cancer; certain familial syndromes and osteosarcoma after retinoblastoma are examples.
Since the records of the WMRCTR began, 156 patients have developed second tumours. The average age at development of a second malignancy was 23 years overall, ranging from an average of 18 for a secondary leukaemia to 28 for non-brain solid tumours. Thirty-nine (25%) of these second malignancies developed in the paediatric age-range (0-14 years). Table 6.4 shows the types and numbers of the original and subsequent diseases, indicating that solid tumours were the most common form of second malignancy (88, 56%), the majority of these carcinomas, usually developing in the radiation field. Brain tumours were the next most common form (51, 33%), many again developing in the radiation field after cranial irradiation. Lymphomas and leukaemias were the least common (9, 6% and 8, 5% respectively).
Table 6.4: Second malignancies in patients diagnosed 1957-2003
|
|
References:
- Office for National Statistics. Cancer statistics registrations. Registrations of cancer diagnosed in 2005, England. Series MB1 no. 36. London:HMSO, 2008
- Ablett S ed. Quest for cure . UK Childrens Cancer Study Group: the first 25 years. London: Trident Communications, 2002
- Stiller C ed. Childhood cancer in Britain: incidence, survival, mortality. Oxford: OUP, 2007
- West Midlands Key Health Data 2004/5. University of Birmingham DEPH report no 52. 2005
- Powell JE, Parkes SE, Cameron AH and Mann JR. Is the risk of cancer increased in Asians living in the UK? Archives of Disease in Childhood 1994;71:398-403
- Borugian MJ, Spinelli JJ, Mezei G, Wilkins R, Abanto Z, McBride ML. Childhood leukemia and socioeconomic status in Canada. Epidemiology 2005;16:526-31
- Cancer Research UK. Briefsheets: Cancer in Children. London: CRUK, September 2007
- Curry HL, Parkes SE, Powell JE and Mann JR. Caring for survivors of childhood cancer: the size of the problem. European Journal of Cancer 2006;42:501-8
- Parkes SE, Jenkinson HC, Griffiths A, Kinch D and Mann JR. Is postal follow-up of childhood cancer survivors a worthwhile exercise? Pediatric Blood and Cancer 2008;50:80-8
For more information please contact Sarafina
Cotterill
© Public Health, Epidemiology and Biostatistics Unit, School of Health and Population Sciences, University of Birmingham