West Midlands Key Health Data 2007/08
CHAPTER FOUR: WEST MIDLANDS AMBULANCE SERVICE DATA COLLECTION AND ANALYSIS
Tracy Rayment-Bishop
Main Body
7: Healthcare Associated Infections (HCAI)
4.1 Introduction
West Midlands Ambulance Service (WMAS) attends around 600,000 patients per year, serving a population of around 5.3 million people across the region.
The Trust was formed in July 2006 with the merger of Coventry & Warwickshire, Hereford & Worcestershire and West Midlands Ambulance Service (only covering the Birmingham and Black Country and Shropshire areas). Staffordshire joined the Trust in October 2007.
All emergency calls come in to our Emergency Operations Centres (EOCs) across the region, and every call that is received generates a unique log on the computer systems within these EOCs
4.2 What data is collected?
Call data
When a call comes into the EOC, key information is collected including the location of the incident, a brief description of the emergency and the phone number of the caller. This is to enable us to send the appropriate resources and to give the responding ambulance crews vital information to best treat the patient.
As soon as the location of the incident is identified, the call is passed to our dispatchers in order for them to assign a suitable vehicle (resource) to the case. This includes traditional ambulances, rapid response cars, motorcycles and air ambulances, of which there are four in the region. There are also around 2,500 volunteer Community First Responders. All of these are dispatched from the EOC.
While the dispatchers are assigning a vehicle, the call taker continues to ask the caller a series of detailed questions regarding the patient’s condition to determine the chief complaint and category of call, using the Advanced Medical Dispatch Priority System (AMPDS). The answers to the questions determine the chief complaint and the category of the call.
- Chief complaint: it is important to note that the chief complaint of the patient is based upon the symptoms given by the caller, not the underlying cause. There are a few exceptions to this but if, for instance a patient is unconscious due to drinking excess alcohol, they are categorised as ‘unconscious’ - the alcohol is not recorded as a cause at that point.
- Category of call: calls are categorised according to the seriousness of the patient’s condition and this determines our target response times.
|
Time data
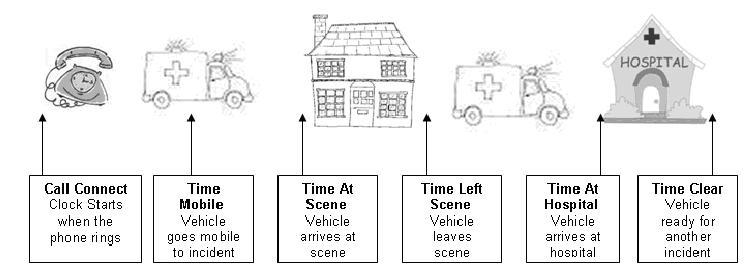
National Ambulance targets are based on response times to incidents, an incident being defined as a resource arriving at the scene. The clock starts as soon as the call is connected to the control room switchboard.
At every stage throughout the call process and subsequent responses to and treatment of the patient, times are automatically recorded. Times are generated for all calls received and every response sent to an incident not just the first vehicle on scene. These are shown below:
|
The data collected during the call and the time data received from vehicles is very consistent and accurate. The questions asked by the call taker are pre-determined to increase not only the accuracy but also the consistency of the data captured. The ambulance crew presses a button at each stage in their response to an incident to generate the time data from the vehicles, assuring accuracy of data as well as consistency.
Patient Report Form
Whilst attending an incident the ambulance crew record the patient’s medical details as well as any treatment given on a paper based Patient Report Form (see Section 4.5). This data is held separately from the data recorded within the call and the time information described above. They can be linked, although there is, inevitably a small amount of unmatchable data.
4.3 Information for PCTs
Analysis of data captured during calls and from the vehicles can produce detailed and accurate information both internally for the Ambulance Service and to external partners such as Primary Care Trusts (PCTs) and Acute Trusts.
Number of calls
At a top level, incident volume data is a key part of our data analysis. Internally this enables resources to be targeted most effectively and forecasts to be made of future demand across the region. This data can also be of benefit to external partners by informing the planning of provision of alternative or specialist services and in predicting demand.
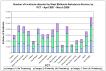
Figure 4.1 (below) illustrates the number of emergency incidents attended by the WMAS for each PCT in the region over the last financial year. It shows the total demand by PCT and also what proportion of these incidents fell into each of the 3 categories. Note that the information relates to the PCT area in which the incident occurred in, and not necessarily where the patient lives.
Figure 4.1: Number of Incidents attended by West Midlands Ambulance Service, by PCT - April 07 - March 08
|
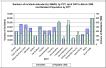
Alone this data shows the mix of calls by categorisation. However, it is also valuable to compare this data to other datasets to determine any other trends. The following chart combines the above data with resident population per PCT.
Figure 4.2: Numbers of incidents attended by WMAS, by PCT, April 2007 to March 2008 and Resident Population by PCT
|
In order to get a direct comparison across the region, Figure 4.3 shows the volume of calls per resident population (‘000)
Figure 4.3: Volume of Incidents attended by WMAS per 1000 residents by PCT April 2007 March 2008
|
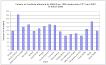
As the Figures 4.1 – 4.3 show, there is a wide variation across the region both in the volume of incidents West Midlands Ambulance Service attends and the rates of calls per resident population. It is, however, important to note that ambulance incident volumes are based on the PCT where the incident occurred, not where the patient lives. This will inflate the rates of calls in some PCTs, particularly those that have a lot of visitors from other PCT areas.
For example, Heart of Birmingham PCT has the highest volume of incidents in relation to the resident population. The main entertainment areas of Birmingham City Centre lie within this PCT so there are many extra non-resident people, particularly at weekends, who may require an ambulance.
Of course other factors may influence the rate of ambulance call outs in a geographical area. Levels of social deprivation, the degree of rurality of the area and the provision of alternative pathways of emergency care for local residents by the PCT are all factors that can attribute to the volume of incidents.
Further analysis of this volume data by days of the week, or hours of the day could reveal useful information for healthcare planners. Comparing commercial with residential areas one might expect to see a difference between weekday and weekend ambulance activity. The time of year can also influence the volumes of calls. During summer months, the volume of ambulance incidents decreases as people are out of the region on holiday, whilst in winter they increase with more incidents caused by poor weather such as falls and Road Traffic Collisions.
Type of calls - chief complaint
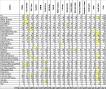
Table 4.1 shows the breakdown of calls for each PCT by chief complaint (AMPDS code) for a one-month period. This allows us to see a much greater level of detail in relation to the demand placed on the ambulance service, Information such as this may be of particular use when a PCT is looking at the provision of alternative care pathway services.
For example compare Worcestershire PCT and Telford and Wrekin PCT. Total demand was only 3.2 times greater in Worcestershire yet, when looking specifically at falls, there are over 10 times the number of call outs for falls in Worcestershire than Telford and Wrekin. Falls accounted for 6% of demand in Telford and Wrekin, yet they accounted for almost 20% in Worcestershire. This type of comparative information could be of great interest to PCTs when performing demand analysis and planning alternative care pathway provision for falls. This type of information could provide key detail regarding targeting services and resources to specific demand.
The n/a and *na categories are where no chief complaint code was recorded. These are, in the main, due to computer failure, and cases have had to be recorded on paper. They are then retrospectively added onto the computer system, but the code cannot always be added as the questions that generate the chief complaint code (AMPDS code) cannot be completed afterwards.
Table 4.1: Incidents attended by WMAS, by chief complaint, for each West Midlands PCT. January 2008 (highest figures in yellow for each category)
|
There are many ways in which this data could be further analysed to provide information that is of use to PCTs. Such analyses might include:
- The volume of calls for each of these chief complaints by category (A,B,C) per PCT: the number of these patients transported to hospital could be determined as well.
- Useful information might be gained by looking at the age of the patient against the chief complaint.
- The data could be broken down by postcode area, so for example it would be possible to identify if there was a certain postcode area where a lot of the falls are taking place in Worcestershire. Looking at the data in this level of detail might influence preventative action and health promotion within the PCT.
- Clusters of calls can be identified, where particular types of call (e.g. assaults) re prevalent within specific areas such as postcode area. This could be tied in with socio-demographic data to identify whether explanations can be found for specific clusters.
Some of these analyses have been performed recently at the request of a number of PCTs in the region.Where appropriate these requests are developed into routine reports that go out to all PCTs in the region on a monthly/quarterly basis.
4.4 Information for Acute Trusts
West Midlands Ambulance Service data is collected and analysed by individual hospitals. Information regarding hospital delays in patient handover is routinely shared with both acute trusts and PCTs. This information is also monitored live within our control rooms in order for us to work together with acute trusts to manage capacity and handover delays in real time. This helps to prevent backlogs of ambulance crews. Demand forecasting is shared with the acute trusts as another tool to aid in managing capacity.
If required, information can also be produced to identify both the geographic area of incident and the types of cases that are taken to each hospital. This can be used by acute trusts to examine whether the patients are being taken into the correct hospital according to agreed boundaries. This information could also help in assessing whether specialist services in particular hospitals are being used effectively, for example Selly Oak Hospital in Birmingham has a specialist burns centre. Data purely for burns patients could be mapped to see if they were being taken to their nearest, or specialist, hospital. It could also be reversed to show the geographic spread of the burns patients taken to Selly Oak.
An example of the type of mapping that is possible is seen below in Map 4.1. This shows all Category A transports by hospital over a one-year period. Breaking down the information by hospital shows from which geographic area patients are taken to each hospital. It also shows areas of cross over where patients are taken to a hospital, which isn’t geographically closest.
Map 4.1: Volume of Patient Transports 2005-2006 Coloured by Destination
|

4.5 Patient Report Form Data
Ambulance crews complete a Patient Report Form (PRF) by hand every time they see a patient even if no treatment is administered. A form (sample below) is filled in for each patient seen at the incident. Approx 50,000 Patient Report Forms are filled in every month.
|
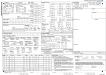
The Patient Report Form contains medical based information to enable us to provide an accurate description of the condition of the patient as well as any treatment given by the crew. A copy of this form is left with the patient at home if they are not transported to hospital, or given to hospital staff when the patient is handed over at hospital to ensure that a continuous record of the patient’s care is maintained.
In addition to providing the patients and hospitals with medical information, these forms are used for Clinical Audit.
All PRFs are scanned into a computer system and key data is manually processed on all forms. All the auditable data is collected electronically during this process. The only fields not collected are the free text boxes (as detailed on image above). An electronic image is created in the scanning process and this is used if the form is required in future.
Clinical audit is an important function within the ambulance service as it ensures that correct methods of treatment are used and that treatment is accurately recorded. We have an internal clinical audit department who undertake both routine and adhoc audits as required by the Trust and nationally.
The data quality of these forms is dependant upon the accuracy of the information given at the time (e.g. a time taken from a watch rather than the synchronised times received from the vehicles). This is because they are completed manually whilst the crews are at incidents and some responses are subjective.
The date and unique number given to every case links PRF data and the call/time data. As the two data sets are held separately there is, inevitably, a small amount of unmatchable data. However for most data requests we will use the call/time data using the chief complaint as in the example above (Table 4.1) rather than linking the two datasets.
4.6 Electronic Patient Report Form Emergency Care System (ECS)
The Emergency Care System project is underway in the Coventry and Warwickshire Locality which forms the initial stage of a proposed regional implementation. Roll out of ECS began in April 2008, with a potential roll out planned across the Trust.
ECS allows the staff to electronically enter the patient’s details when at an incident which are stored on the NHS database. This has a number of benefits both to the patient and to the Trust. The patient’s details can be electronically viewed on a database and information can be accessed and collated in a number of ways. Because the data does not have to be scanned and manually processed, more timely data analysis can take place. The other main internal benefit is the increase in data quality and consistency of the data that is received from the ECS.
In future developments of ECS, additional uses of the data will be released, such as the potential to allows the receiving acute trust to view the information relating to a patient in real time rather than waiting for the ambulance to arrive with the patient. This can save valuable time in the treatment of the most seriously injured patients. The receiving acute trust will be able to integrate the demographics into the hospital record system therefore improving current established paper hospital handover data.
4.7 Internal use of Information
Within the Ambulance Trust the data collected is used to enable the Trust to meet the demands of the public. Demand forecasting is the most typical analysis performed and this is based on both current and historical data. It is broken down to identify exactly where demand is likely to be.
Dynamic Resource Management is key to meeting demand and arriving at the maximum number of incidents in the minimum amount of time. Analysing data on an hour-by-hour basis is also used to ensure the number of vehicles available meets the likely forecast demand.
Mapping is used to identify areas where we fail to reach patients quickly and allows us to place new vehicles or redeploy resources to cover demand.
At a more local level, cardiac data is analysed at postcode area level to inform the placement of defibrillators at key public sites such as shops or leisure centres. This work is done in conjunction with the British Heart Foundation. Training is then provided by the Ambulance Service to members of staff at these locations to use the equipment and very often help save the life of cardiac arrest patients.
In addition to analysis of historical data, real-time information such as the volume of calls and performance against targets is used on a daily basis within the EOCs. Having this data available in a live context means that any problems such as hospital delays or with performance against our response targets can be identified and remedial action can be implemented immediately.
4.8 Conclusion
The volume and accuracy of the data collected by the ambulance service means that it can prove a valuable tool both internally and externally for partner organisations.
West Midlands Ambulance Service currently provides key data to PCTs and acute trusts in the region. This includes our performance against key targets by PCT and the volume of calls undertaken per PCT every month.
In conjunction with the PCTs, work to provide a wider range of routine information to partner organisations is ongoing, at the same time this ensures that the distributed data is both relevant and consistent.
Working with key partners, data from the West Midlands Ambulance Service can help to develop, monitor and improve healthcare provision across the region.
|
For more information please contact Sarafina
Cotterill
© Public Health, Epidemiology and Biostatistics Unit, School of Health and Population Sciences, University of Birmingham