West Midlands Key Health Data 2007/08
CHAPTER THREE:THE NHS CARBON FOOTPRINT
ESTIMATING THE CO2 EMISSIONS OF PATIENT JOURNEYSDr Richard Wilson
Main Body
7: Healthcare Associated Infections (HCAI)
| “The environment, which shapes our lives and our health, is under threat from climate change. By taking action to become a low carbon organisation, the NHS can help to combat the direct risks to health of climate change.” | ||
| Rt Hon Dawn Primarolo MP Minister for Public Health |
3.1 Introduction
Climate change is recognised as one of the most significant challenges facing the world, and it will have serious implications for health and for the NHS. Health depends on a wide variety of determinants, and many of them (for example temperature, pollution levels, access to food and water, and stress levels) will be affected by climate change. In the UK the positive effects of a warmer climate, such as a reduction in cold-related deaths, are likely to be outweighed by a series of negative impacts, such as:
- An increase in heat-related deaths – predicted to reach 20,000 a year in the UK by 2050 due to more frequent and severe heat waves
- Increased cases of skin cancer and cataracts
- Injuries and infectious diseases as a result of increased flooding – a Foresight report predicted that by 2080 over 3 million people in the UK could be at risk from flooding
- Anxiety and depression linked to physical and economic insecurity
- Respiratory disease, insect-borne disease, and food poisoning are also expected to increase (1)
On a global and national scale, the poorest countries and communities who are less able to adapt, will suffer the most severe consequences, exacerbating concerns about existing health inequalities.
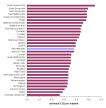
It is has been estimated that the average person in the West Midlands produces 7.6 tonnes of CO2(t CO2) every year. This ranges from a low of 5.3 t CO2 for people living in Nuneaton and Bedworth to a high of 11 t CO2. (2)
Figure 3.1: Carbon dioxide emissions, 2005, tonnes per person
|
The Climate Change Bill (4) will commit the Government to reducing the UK’s carbon emissions by at least 60% by 2050, making the UK the first country in the world to put reducing carbon emissions into law. The NHS currently has a target of a 15% reduction in primary energy consumption between 2000 and 2010, as well as a target to improve energy efficiency.
Currently the NHS is not on track to meet these targets; despite some improvement in energy efficiency, total energy consumption increased in the NHS by 7.0% between 1999/00 and 2004/5. Corporately the NHS is dedicated to becoming an exemplar for public sector action on climate change and sustainability. The Sustainable Development Unit (SDU) has been set up which will lead on a carbon reduction strategy for the NHS, in addition to wider sustainable development issues such as the role of the NHS as a good corporate citizen.
The SDU has published the first NHS carbon footprinting report that has calculated that 18 million tonnes of carbon dioxide (Mt CO2) each year contributing approximately 3 per cent of total England emissions. The NHS in England is the largest contributor to public sector emissions, being responsible for 30 per cent of the whole of England’s public sector emissions (5).
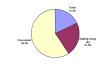
The greatest proportion of CO2 emissions comes from the creation and distribution of the equipment and consumables that the NHS purchases annually at 11.07 Mt CO2 (59.5%) Travel accounts for 3.4 Mt CO2 (18.3%).
Figure 3.2: NHS England CO2 emissions: Primary sector breakdown, 2004
|
The emissions for travel have been further broken down by Patients and visitors, Staff and Business travel. The estimates of emissions from patient, visitor and staff commuting travel are estimated from the Transport Statistics Bulletin: National Travel Survey 2006, Department for Transport. These emissions are then added to those calculated from the business/fleet/patient transport services (PTS) travel emissions which are obtained from an Input-Output model. This analysis found that patients’ own travel to and from services was the greatest contributor to emissions making up 1.53Mt CO2 (56.2%); followed by staff commuting and travel on NHS business including ambulances and patient transport services around 0.75Mt CO2 (Figure 3.3)
Figure 3.3: NHS England CO2 emissions: Travel emissions by sub-group, 2004
|

The Department for Transport (DfT) has forecast that ‘business as usual’ transport-related emissions in the UK will rise by 35 per cent by 2030 (over a 1990 baseline). Under this scenario, NHS transport-related emissions are also predicted to increase. It is therefore increasingly important for the NHS to recognise, understand and take responsibility for its CO2 emissions. Green travel plans can promote healthy methods of transport and help to change travel patterns of patients, staff and visitors; encouraging active travel (such as walking, cycling or taking public transport) in place of using a car can reduce the carbon footprint of the organisation and deliver multiple public health benefits.
3.2 This Project
These national models are limited as they cannot be tailored to individual PCTs or providers. To address this gap in our knowledge, a project was conceived to look at how we can use our resources in the Region to produce a methodology that would be replicable and updateable. The concept we came up with was to an estimate the total CO2 emitted as the result of patient journeys to hospital. To enable this, the Regional GIS Service created a matrix of distances from the centre of each Lower Super Output Area (LSOA) to each major acute provider. This matrix is based on the shortest road distance.
Different types of admissions and attendances will have different journey profiles and therefore a set of hypothetical journey profiles were produced upon which to base the model.
Table 3.1: Model journey profiles for patients and visitors
|
|
The assumptions for these journey profiles seem fairly intuitive. A patient going into hospital for an overnight stay will either be driven to hospital by a relative or a carer, by patient transport services or private taxi. The person who took them would then have to return most likely to the start position (home). On discharge the patient is likely to be taken home by the same transport method. If they stay overnight then it is likely that on average a patient will have at least one set of visitors every day. For day cases, it is assumed at least half the patients will park during their visit, whilst others will be dropped off and picked up later, given 1.5 return journeys per admission. All of these models ignore public transport usage, which would reduce the Carbon emissions per patient. For this study data on patient travel to hospital by public transport was not available so the journeys could not be adjusted for this.
The strength of this methodology is the ability to vary the assumptions: increasing the number of visitors; reducing the number of patient’s journeys (if statistics on overnight parking is available); or introducing a public transport dimension for buses or trains. The model is very flexible in this regard. It is less flexible in regard to varying the starting points for visitors and or emergencies, although it is possible to change the destination allowing planners to consider the benefits off placing services closer to home.
The estimates of CO2 per km were taken from the Transport Direct website (6). There are two estimates provided (0.128kg per km in a small car and 0.257 kg per km in a large car) and for the purposes of this study the average of the two were used. The model is not restricted to these, it is possible to use any alternative or vary the emissions estimate to reflect changes in car ownership trends towards lower CO2 emitting vehicles.
Due to the level of data required for the model it was decided for this example to restrict the output to just one PCT, Sandwell. As an example PCT it is not necessarily the most representative of the Region being a wholly urban PCT with no rural areas. In 2006/7 there were 470,343 hospital admissions and attendances, most being outpatients. The average journey to hospital was only 4.9km. The longest average journeys were recorded for elective admissions as many of these were seen outside the PCT in Dudley and Birmingham.
Table 3.2: Hospital attendances and average journey length
|
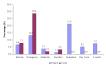
The model estimates that patient related travel results in 6.8million km of travel and just under 1,400 t CO2 (Table 3.3). Patients attending for an Outpatient appointment contribute the greatest proportion of emissions (21.3%)(Figure 3.4). Visitor journeys contribute just over 41% of emissions. When we look at the combination of patients and visitors, those resulting from an emergency admission produced the greatest emissions.
Table 3.3: Patient and Visitor journeys and estimated CO2 emissions for Sandwell PCT
|
|||||||||||||||||||||||||||||||||||||||||||||||||||||||||||||||||||||||||||||||||||||||||||||||||||||||||||||||||||||||
Figure 3.4: Patient and Visitor journeys and proportion of total estimated CO2 emissions for Sandwell PCT
|
As this method is based on patient data the model can be re-run for specific age, sex, and diagnosis or condition group. As the data has a geographical reference, SOA, it is also possible to map the areas with the greatest emissions and how that relates to the provision of health services. It is possible, therefore, to investigate how different service re-design options would impact on carbon emissions, for example delivering outpatient clinics outside of hospital. Using the road network, a distance matrix for alternative providers could be produced and substituted into the model changing the destination of the patient to be a clinic rather than a hospital.
The mapping of the emissions data for Sandwell residents (where ever they are treated) does not produce any startlingly unusual results with the areas around Sandwell Hospital, the main provider, having the lowest levels with emissions increasing as you move further away (Map 3.1 and 3.2). . Interestingly the proximity of other providers, especially Dudley does not appear to have a substantial reduction on emissions for those living in the west of the PCT. This is particularly true for Outpatients indicating that there are significant issues in the South West of the PCT in terms of access and with substantial knock effects for the amount of CO2 emitted.
Map 3.1: Total emissions for patient and visitor journeys by Super Output Area (SOA)
|

Map 3.2: Emissions for outpatient attendances by Super Output Area (SOA)
|

3.3. Conclusion
The model goes further than the SDU initial assessment based on the National Transport Survey, as it actually allows Trusts to understand the impact of the location of their services on the total carbon emissions. It clearly works to highlight the areas where the provision of services does little to reduce emissions. The model would allow PCTs to plan how they could reduce transport related emissions and over time show whether they have been successful or not. The plan is now to produce instructions and an excel workbook to enable others to replicate the model for their own use and to test out different scenarios.
It is interesting that the model used here produces a greater emission contribution for visitors than the SDU model, 41.5% compared to only 19.9%.
References:
- Sustainable Development Commission (2008) Healthy Futures #7: The NHS and Climate Change. http://www.sd-commission.org.uk/publications.php?id=709 (last accessed July 2008)
- DEFRA, 2007. e-Digest Statistics about: Climate Change Emissions of carbon dioxide for local authority areas. http://www.defra.gov.uk/Environment/statistics/globatmos/galocalghg.htm (last accessed July 2008)
- Association of Public Health Observatories (2007) Health Profiles
http://www.apho.org.uk/default.aspx?QN=HP_ANALYSE (last accessed July 2008)
- Secretary of State for Environment Food and Rural Affairs (2007) Draft Climate Change Bill
http://www.official-documents.gov.uk/document/cm70/7040/7040.pdf (last accessed July 2008)
- Sustainable Development Commission (2008a) NHS England carbon emissions:
Carbon footprinting report http://www.sd-commission.org.uk/publications.php?id=733 (last accessed July 2008)
- Transport Direct (2008)
http://www.transportdirect.info/Web2/JourneyPlanning/JourneyEmissionsCompare.aspx (last accessed July 2008)
For more information please contact Sarafina
Cotterill
© Public Health, Epidemiology and Biostatistics Unit, School of Health and Population Sciences, University of Birmingham