West Midlands Key Health Data 2007/08
CHAPTER FIVE: SYNTHETIC ESTIMATES OF ATTENDANCES AT EMERGENCY DEPARTMENTS IN THE WEST MIDLANDS FOLLOWING ASSAULT
Gavin Rudge and Sally Fillingham
Main Body
7: Healthcare Associated Infections (HCAI)
5.1 Introduction
According to the British Crime Survey (1) (BCS), there has been a steady decline in most crimes, including violent crimes, since 1995. However violent crime remains a common phenomenon. In the latest BCS, 4.1% of males and 2.3% of females reported that they had been a victim in the year prior to the survey. In the group most likely to be a victim, males aged between 16 and 24, this proportion was 13.4%.
The incidence of violence in populations is difficult to model. There are strong associations with alcohol consumption and also much seasonality. Also, multi-variate analysis shows that patterns can be complicated by things like weather and even sporting events (2,3).
Tools like the BCS and data on reported crime from the Police can help build a picture of the incidence of violent crime, but the impact on health services is less easy to determine. Within the NHS, assault cases are most commonly seen in the emergency department (ED). Most presentations are of ‘walking wounded’ whose injuries are treated without admission and who are discharged from care within hours of arrival. The few cases that are serious enough to need admission are easier to monitor but the rest are not. The data set used in EDs can help, but the variable needed to determine the reason for presentation is captured poorly in many EDs and not at all in others.
This is a particular problem for commissioners of health care. No-one really knows, even approximately, what kind of burden assaults impose on the wider health economy without being able to count these non-admitted cases. The purpose of this brief chapter is to take a limited range of data that does exist on attendances for assault and use them to make an estimate of how many there are in the regional population. Also it will explore some of the demographic and socio-economic characteristics of this group of attenders.
5.2 Method
At the outset there was choice of methods that could be used to make these estimates. There is a family of statistical methods used in missing data problems that involve building complex multi-variate models of the data that are available and using outputs of these to populate our estimates. We opted for a simpler method that took rates from a known population and applied them to our total population of interest taking into account the demographic and socio-economic make-up of the populations concerned.
Whilst the Accident and Emergency minimum data set (A&EMDS) is captured inconsistently in hospitals in the region, in some EDs, the data quality is very good. Some work specifically relating to assaults has been done by the project before (2) but this related to one large ED only. Since then, the A&E Surveillance Centre (A&ESC) has been working on a meta-data set to systematically assess data quality in all the EDs for which data are available. Drawing upon this work, this analysis takes a subset of data from Units specially chosen because the particular variables needed to examine assault were felt to be unusually complete. Rates are calculated using these data which, after being stratified by age sex and deprivation, are applied to the regional population.
Using the metadata we had already determined, we selected seven EDs where it was decided that assault data were identifiable and likely to be complete. Having identified the hospitals of interest, the next task was to find areas where the residents are highly likely to present at one of the selected units. There are some areas where (usually for geographical reasons) most people with an emergency care need will generally present at one particular hospital. Therefore the cases presenting at that hospital, from that area can give us a fairly accurate picture of the rate at which its residents need emergency care. In other areas the choice of hospital is less predictable and patients may commonly present at more than one hospital. We wanted to restrict our initial analysis to populations where there was very little ‘leakage’ to other hospitals, where there was something akin to a ‘closed’ health economy for emergency care in that area involving a known population largely presenting to one hospital. We had no practical way to measure this using ED attendances alone, owing to gaps in our data collection. However we decided to use emergency admissions to hospital as a proxy. We looked at all of the Lower Level Super Output Areas (LSOAs) in the region and chose those in which more than 90% of all emergency admissions to an acute hospital was to a hospital where one of our target EDs was located. We did this using Hospital Episode Statistics (HES). For this calculation we excluded children and older people as the admission patterns of these groups can be skewed by a range of local service factors.
Once this was done we had a patchwork of SOAs around the region for which we assumed we had virtually all the assault presentations in our ED data set. The total number of residents in this population was estimated at approximately 644,000 people with 3,083 recorded assault cases.
This population was then stratified by Townsend deprivation score quintile (within Region). Specific attendance rates for each five-year age band, sex and quintile were calculated. These were then applied to similarly stratified denominator populations. For both the denominator population of the attenders and for the calculation of the estimated regional rates we used Experian estimates of LSOA population. Confidence intervals were applied using the Wilson procedure and expected totals calculated for Primary Care Trusts (PCTs). Age sex standardised rates were calculated within Townsend quintile using the exact method to calculate confidence intervals.
5.3 Results
Table 5.1: Estimated emergency department attendance counts for assault in the resident populations of PCTs in the West Midlands, 2005/2006
|
Table 5.1 shows the expected number of attendances in the resident PCT populations of the region. As can be seen there is considerable variation, largely due to the demographic and socio-economic composition of the populations.
Figure 5.1: Frequency distribution of estimated ED attendances for assault, by age and sex in the West Midlands Region, 2005/2006
|
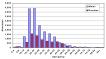
Figure 5.1 shows the total expected counts for males and females by age group. There is a strong correlation between younger populations and low socio economic status. Some of the populations with the most young people are in the poorer inner city areas which amplifies the number of assault victims we find living in these areas.
Figure 5.2: Estimated directly standardised rates of ED attendance for assault, by Townsend quintile of area of residence 2005/2006
|
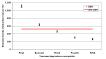
Figure 5.2 shows the expected rates in each of the five Townsend quintiles when directly standardised for age and sex. As can be seen there is more than a three fold difference in the estimated rates between the most deprived and least deprived populations, even when adjusting for age and sex.
Figure 5.3: Directly standardised estimated ED attendance rates per 100,000 for assault, by PCT resident population 2005 / 2006
|
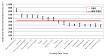
Figure 5.3 shows the expected directly standardised rates of attendance per 100,000 resident population for the PCTs of the Region. The relative attendance rates reflect the impact that deprivation has on the incidence of assaults, even when adjusting for age.
5.4 Discussion
Assault imposes a significant burden on society in terms of the physical and psychological harm to victims, resources of the police and criminal justice system and loss of time to the workforce. Also, especially for those patients who require admission and further treatment, there is a considerable cost to the NHS. However the cost to PCTs of ED attendance alone is not actually that great. The billed care to Primary Care Trusts for the walking wounded is probably in the order of £2.5 - £3 million a year for the whole region, using the tariff costs of attendances. Whilst not a large amount in terms of health spend on say chronic diseases, these events should, firstly, be seen as avoidable and secondly there is an opportunity cost involved in not being able to use scarce emergency resources elsewhere. In particular these events are largely out of normal working hours and so occupy the relatively limited numbers of overnight staff disproportionately.
In terms of the social and demographic patterns observed, we see that it is largely younger males that are victims. This, combined with the higher attendance rates in deprived neighbourhoods, means that there are high expected rates in our most deprived PCTs as they also have comparatively young populations. These findings are unsurprising and are consistent with the findings of the BCS.
There are number of possible weaknesses of the model that has been used here. One of particular concern is the effect of proximity to hospital. Our sample was drawn largely from neighbourhoods which happen to be close to a hospital as this was clearly a factor in making one provider very dominant in its provision of emergency services. Intuitively we would expect that there may be a lower threshold to attend an ED for populations resident proximal to it. We have not attempted to adjust for this in this iteration of estimates. Also it should be noted that in the Region, young, deprived populations where assault is more commonplace do tend to have acute hospitals nearby. Also these estimates have not yet been validated, however it is possible to make some comparisons with the findings of the British Crime Survey. The latest survey suggests that 12% of all respondents sought medical help for their injuries, with just 2% going on to require an admission. Of this 12% it can be assumed that almost all would have presented at an ED. If we crudely apply the proportions of reported assaults in each of the age groups in the 2006/7 BCS to the population of the West Midlands, then apply a blanket 12% ‘sought medical help’ rate to this figure, we arrive at a total of a little over 19,000 ED attenders. Whilst somewhat less than our estimate, the BCS does not include children and also does not count multiple attendances, as respondents are asked if they have been assaulted at all in a twelve month period. If these sources of undercounting were taken into account, the BCS would offer a greater degree of triangulation of our findings.
Apart from providing some baseline assessment of the impact of assault on EDs, this work has provided an opportunity for the A&ESC to develop estimation methods. Assault, along with a great many health phenomena seen in EDs but less common in admitted patient care, remains very difficult to monitor using routinely collected data; neither are there immediate plans to reform data capture in EDs to improve this situation. It is likely that synthetic estimates will remain the best way to use the limited data available for the foreseeable future. These estimates will be tested and validated further and hopefully refined methods using more complete data and more advanced methods can be used to provide better estimates in the future.
References:
- Crime in England and Wales 2007 / 2008, Home Office Statistical Bulletin, the Home Office, London
- Sivarajasingham V, Concoran J, Jones D, Ware A, Shepard J. Relations between violence, calendar events and ambient conditions. Injury 2004; 35:467473
- Deakin C; Thompson F; Gibson C; Green M, Effects of international football matches on ambulance call profiles and volumes during the 2006 World Cup, Emergency Medicine Journal. 2007, 24(6):405-407
- Rudge G, Cheng K, Fillingham S, Cooke M, Stevens A, How has the extension of drinking hours in England affected patterns of emergency department use at a large urban hospital, Annals of Emergency Medicine 2008, 51;(4), 553
For more information please contact Sarafina
Cotterill
© Public Health, Epidemiology and Biostatistics Unit, School of Health and Population Sciences, University of Birmingham