West Midlands Key Health Data 2007/08
CHAPTER ELEVEN: DEMENTIA PREVALENCE IN THE WEST MIDLANDS PCTS, HOW DOES THIS RELATE TO PBR, AND THE EFFECTS OF AN AGING POPULATION
Dr Khesh Sidhu
Main Body
7: Healthcare Associated Infections (HCAI)
11.1 Introduction
The purpose of this chapter is to provide PCT commissioners with estimated dementia prevalence data for their registrant populations as defined at April 2008. In addition, commentary on how this compares with Payment by Results (PbR) spend and the implications of an ageing population are described and discussed.
11.2 Methods
Age specific dementia prevalence rates were applied to PCT registrant populations as at 1st April 2008. This was obtained from a file created by the Commissioning Business Support Agency (CBSA) data warehouse from the NHS Strategic Tracing Service (NSTS) database.
NB these are not gender specific, and registrants over the age of 84 were grouped into an 85+ category.
The populations were projected using the latest (2004 based) population projections from Office of National Statistics (ONS)1 for the next 20 years. It should be noted that there are no PCT specific population projections available from ONS. The author used synthetic estimates of projections from local authorities associated with the PCTs. This is not an exact match for two reasons:
- The resident population of a local authority that is coterminous with a PCT is not the same as the registrant population of the PCT. This is because some patients registered to the PCT may live outside the PCT and local authority boundaries.
- Some local authorities have a number of constituent PCTs. An example of this is Birmingham where 3 PCTs are found within the local authority boundary.
As can be seen, the use of population projections based on local authorities cannot be described as in anyway accurate, however for the purposes of this chapter, they give an indication of the magnitude of the effect the demographic changes are due to have in the next 20 years.
PbR expenditure was defined as all those hospital admissions with a diagnosis of dementia found in diagnosis fields 1 to 8 in the Hospital Episodes Statistics (HES) file. The codes used are for all forms of dementia including Alzheimers, Vascular, Picks and other rarer forms of dementia. The ICD codes used were G30, G31, G32 and F00, F01, F02 and F03. Please note that Outpatient, A&E and Mental Health Trust admissions were not included in the costings as the level of coding in these datasets is inadequate. The costs described are for a 9-month period (April 2007 - December 2007)
Prevalence for young onset dementia (i.e. below 65 years) patients was not calculated and will be a subject of another report.
11.3 Results
There are marked differences between PCTs and their estimated populations of people living with dementia.
|
11.4 How does this relate to PbR Spend?
The table below displays PCT PbR 9 month expenditure, Number of admissions and estimated prevalence.
|
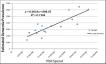
Figure 11.1 below shows the association between PbR expenditure and prevalence (accounting for 71% of the variation).
Figure 11.1: April 2007 - December 2007 PbR costs for People with Dementia against Estimated Prevalence by PCT
|
11.5 What will be the effect of demographic drift over the next 20 years?
Based on the extrapolations described above, it appears that the PCTs with the largest numbers of estimated dementia patients are going to experience the largest numerical rises in populations of people with dementia. The figure 11.2 below is ordered in size of estimated population of registrants living with dementia over the next 20 years.
Figure 11.2: Effect of Demographic drift over next 20 years
|
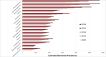
A number of observations can be made:
- The three PCTs with the largest numbers of estimated dementia patients are those that have the largest increases projected increases in the next 20 years (Worcestershire, South Staffordshire and Warwickshire).
- Close scrutiny of the PCTs in general indicate that the proportional rise in numbers of cases is particularly high amongst rural PCTs and can be seen in Herefordshire, North Staffordshire, & Shropshire as well as the three largest PCTs (Worcestershire, South Staffordshire and Warwickshire). The exception to this is Dudley PCT.
- HoBt PCT has an unusually young population compared to most PCTs in the West Midlands and so has a small number of estimated cases and the rise in the future is estimated to be small. It should be noted that the projections for Birmingham City as a whole had been applied to HoBt PCT. This is probably the least accurate projection of all.
- Telford & Wrekin also have a "youngish" population, but the overall population size is small and hence the estimated prevalence is small as well.
11.6 Discussion
There is a clear relationship between estimated dementia prevalence and PbR costs for PCTs. It does not seem unreasonable to assume that this association is causal. If this is the case, then future rises in dementia prevalence will also result in a rise in PbR spend purely due to demographic drift.
This will be exacerbated by a number of factors:
- The onset of Dementia is increasingly being linked to lifestyle. The population of elderly residents of the West Midlands had in some perspectives healthier lifestyles than their children. Obesity, lack of exercise, smoking, alcohol, poor diet, cardiovascular risk and diabetes risk, are all associated with increased lifetime risks of developing dementia. As a result, it may be that the prevalence of dementia rises due to these factors alone.
- Family structure changes also means that there will be fewer carers to look after people with dementia at home and hence there will be an increased propensity to admit people with dementia into care homes as domiciliary care becomes not viable for large populations of people with dementia.
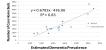
- The current provision of care homes in PCTs is closely matched to estimated populations of people with dementia.
Figure 11.3: PCT specific Estimated Dementia Prevalence against number of care home beds registered in each PCT (Source CSCI)
|
The level of domiciliary care and institutional care will need to rise in the future to look after the rising numbers of dementia patients. If this doesn't occur, then there will be more vulnerable people with dementia living at home and having emergency admissions into hospitals. This will further inflate the PbR spend.
The estimated PCT populations of people with dementia in 2008 and projections are found in Appendix A below.
Reference:
- www.ons.gov.uk
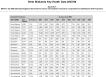
Appendix A
WM PCT Apr 2008 Estimated Registrant Dementia Prevalence with synthetic Projections extrapolated from 2004 Based ONS Projections
|
For more information please contact Sarafina
Cotterill
© Public Health, Epidemiology and Biostatistics Unit, School of Health and Population Sciences, University of Birmingham